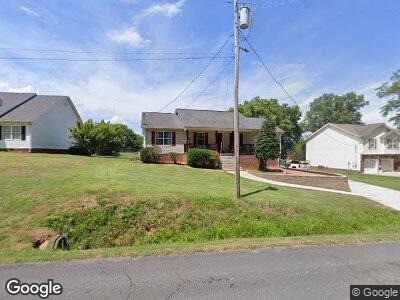
3839 Brock Rd SE Dalton, GA 30721
Estimated Value: $227,497 - $273,000
3
Beds
2
Baths
1,640
Sq Ft
$148/Sq Ft
Est. Value
About This Home
This home is located at 3839 Brock Rd SE, Dalton, GA 30721 and is currently estimated at $242,124, approximately $147 per square foot. 3839 Brock Rd SE is a home located in Whitfield County with nearby schools including Cedar Ridge Elementary School, Eastbrook Middle School, and Southeast Whitfield County High School.
Ownership History
Date
Name
Owned For
Owner Type
Purchase Details
Closed on
Feb 4, 2010
Sold by
Us Bank
Bought by
Moreno Perla
Current Estimated Value
Home Financials for this Owner
Home Financials are based on the most recent Mortgage that was taken out on this home.
Original Mortgage
$110,907
Outstanding Balance
$76,333
Interest Rate
5.37%
Mortgage Type
FHA
Estimated Equity
$177,707
Purchase Details
Closed on
Aug 19, 2008
Sold by
Not Provided
Bought by
Moreno Perla E
Purchase Details
Closed on
Nov 29, 2004
Sold by
Perez Octavio
Bought by
Lopez Ausencio
Purchase Details
Closed on
Feb 4, 2003
Sold by
Watts Gilbert H
Bought by
Perez Octavio
Purchase Details
Closed on
Oct 15, 2002
Sold by
Perez Octavio and Wayne Burgess
Bought by
White Sherrill E
Purchase Details
Closed on
Oct 14, 2002
Sold by
White Sherrill E
Bought by
Watts Gilbert H and Payne Jeff
Purchase Details
Closed on
Aug 23, 2002
Sold by
Watts Gilbert H and Payne Jeff
Bought by
Watts Gilbert H and Payne Jeff
Create a Home Valuation Report for This Property
The Home Valuation Report is an in-depth analysis detailing your home's value as well as a comparison with similar homes in the area
Home Values in the Area
Average Home Value in this Area
Purchase History
| Date | Buyer | Sale Price | Title Company |
|---|---|---|---|
| Moreno Perla | $115,000 | -- | |
| Moreno Perla E | -- | -- | |
| Lopez Ausencio | $154,000 | -- | |
| Perez Octavio | -- | -- | |
| Watts Gilbert H | -- | -- | |
| White Sherrill E | -- | -- | |
| Watts Gilbert H | $37,500 | -- | |
| Watts Gilbert H | $39,000 | -- |
Source: Public Records
Mortgage History
| Date | Status | Borrower | Loan Amount |
|---|---|---|---|
| Open | Moreno Perla | $110,907 | |
| Closed | Moreno Perla | $5,000 |
Source: Public Records
Tax History Compared to Growth
Tax History
| Year | Tax Paid | Tax Assessment Tax Assessment Total Assessment is a certain percentage of the fair market value that is determined by local assessors to be the total taxable value of land and additions on the property. | Land | Improvement |
|---|---|---|---|---|
| 2024 | $1,786 | $74,724 | $3,960 | $70,764 |
| 2023 | $1,786 | $66,246 | $2,898 | $63,348 |
| 2022 | $1,371 | $55,023 | $2,844 | $52,179 |
| 2021 | $1,371 | $55,023 | $2,844 | $52,179 |
| 2020 | $1,406 | $55,023 | $2,844 | $52,179 |
| 2019 | $1,424 | $55,023 | $2,844 | $52,179 |
| 2018 | $1,428 | $54,607 | $2,428 | $52,179 |
| 2017 | $1,429 | $54,607 | $2,428 | $52,179 |
| 2016 | $1,244 | $49,886 | $2,428 | $47,458 |
| 2014 | $1,359 | $57,864 | $10,406 | $47,458 |
| 2013 | -- | $57,864 | $10,406 | $47,457 |
Source: Public Records
Map
Nearby Homes
- 3617 Winland Dr SE
- 00 Headrick Cir SE
- 1860 Flair Knoll Dr SE
- 185 Cedar Ridge Rd
- 4119 Tibbs Bridge Rd SE
- 1142 Ben Hill Rd SE
- 0 Tibbs Bridge Rd SE
- 1080 Winnwood Dr
- 1943 Upper Ridge Rd SE
- 116 Butterfield Dr
- 3117 Circleview Dr SE
- 4698 Tibbs Bridge Rd SE
- 00 Hill Rd
- 00 Old Grade Rd
- 185 Cedar Ridge Rd SE
- 8011 Starr Dr SE
- 282 Cedar Ridge Rd SE
- 404 Lakeview Dr SE
- 118 Hill Rd
- 118 Revina Dr
- 3839 Brock Rd SE
- 3843 Brock Rd SE
- 3835 Brock Rd SE
- 3847 Brock Rd SE
- 3831 Brock Rd SE
- 166 Jericho Way
- 3821 Brock Rd SE
- 3817 Brock Rd SE
- 3819 Brock Rd SE
- 0 Brock Rd SE Unit 3267602
- 0 Brock Rd SE Unit 5050366
- 0 Brock Rd SE Unit 80018
- 00 Brock Rd SE
- 3853 Brock Rd SE
- 3815 Brock Rd SE
- 3851 Brock Rd SE
- 3849 Brock Rd SE
- 3816 Brock Rd SE
- 3811 Brock Rd SE
- 3812 Brock Rd SE