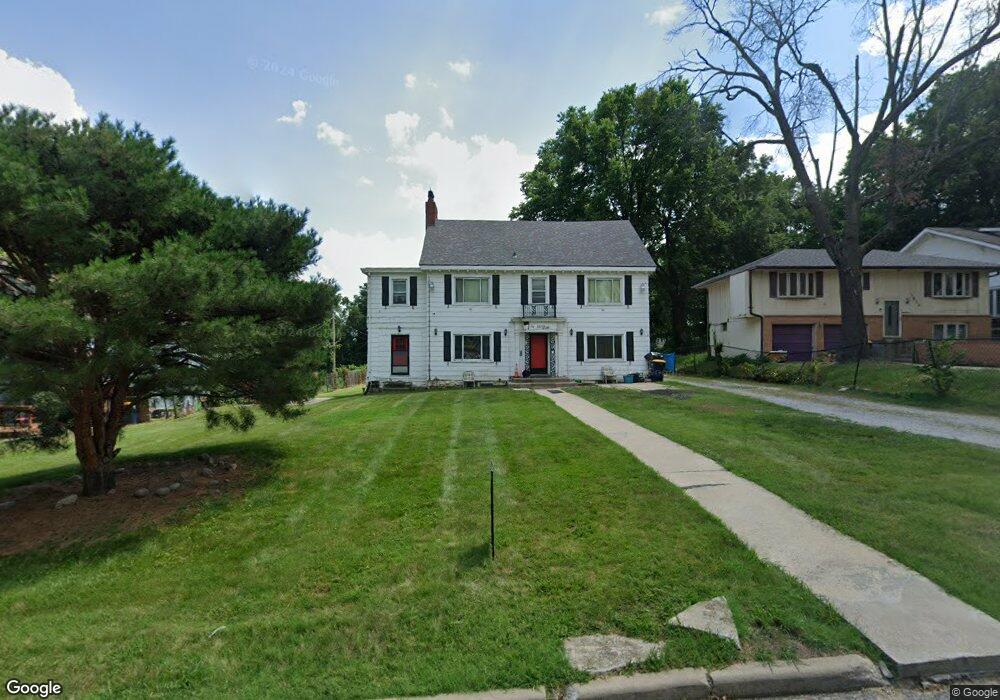
3839 E 62nd St Unit A Kansas City, MO 64130
Swope Parkway-Elmwood NeighborhoodEstimated Value: $220,543
5
Beds
5
Baths
3,590
Sq Ft
$61/Sq Ft
Est. Value
About This Home
This home is located at 3839 E 62nd St Unit A, Kansas City, MO 64130 and is currently priced at $220,543, approximately $61 per square foot. 3839 E 62nd St Unit A is a home located in Jackson County with nearby schools including Benjamin Banneker Elementary School, Central Middle School, and Southeast High School.
Ownership History
Date
Name
Owned For
Owner Type
Purchase Details
Closed on
Jul 22, 2010
Sold by
Riley Garlington Carletta
Bought by
Divine Revelations Llc
Current Estimated Value
Purchase Details
Closed on
Dec 19, 2001
Sold by
Arcata Investments 2 Llc
Bought by
Garlington Elbert and Garlington Carletta R
Purchase Details
Closed on
May 26, 2000
Sold by
Brown James H and Brown Delores H
Bought by
Arcata Investments 2 Llc
Purchase Details
Closed on
Mar 27, 2000
Sold by
Federal Home Loan Mtg Corp
Bought by
Atlantic Mtg & Investment Corp
Purchase Details
Closed on
Jan 25, 2000
Sold by
B & B Associates Inc
Bought by
Brown James H and Brown Delores H
Purchase Details
Closed on
Apr 7, 1997
Sold by
Mellon Mtg Company
Bought by
Federal Home Loan Mortgage Corporation
Purchase Details
Closed on
Mar 31, 1997
Sold by
Federal Home Loan Mortgage Corporation
Bought by
B & B Associates Inc
Purchase Details
Closed on
Nov 7, 1996
Sold by
Lenley John H and Lenley Vera Jane
Bought by
Mellon Mtg Company
Create a Home Valuation Report for This Property
The Home Valuation Report is an in-depth analysis detailing your home's value as well as a comparison with similar homes in the area
Home Values in the Area
Average Home Value in this Area
Purchase History
| Date | Buyer | Sale Price | Title Company |
|---|---|---|---|
| Divine Revelations Llc | -- | None Available | |
| Garlington Elbert | -- | Ati Title Company | |
| Arcata Investments 2 Llc | -- | First American Title Ins | |
| Atlantic Mtg & Investment Corp | -- | Mo Kan Title Services Llc | |
| Brown James H | -- | First American Title Ins | |
| Federal Home Loan Mortgage Corporation | -- | -- | |
| B & B Associates Inc | -- | -- | |
| Mellon Mtg Company | $33,217 | -- |
Source: Public Records
Tax History Compared to Growth
Tax History
| Year | Tax Paid | Tax Assessment Tax Assessment Total Assessment is a certain percentage of the fair market value that is determined by local assessors to be the total taxable value of land and additions on the property. | Land | Improvement |
|---|---|---|---|---|
| 2025 | $1,500 | $20,102 | $4,750 | $15,352 |
| 2024 | $1,500 | $19,000 | $3,306 | $15,694 |
| 2023 | $1,485 | $19,000 | $3,306 | $15,694 |
| 2022 | $1,250 | $15,200 | $2,641 | $12,559 |
| 2021 | $1,246 | $15,200 | $2,641 | $12,559 |
| 2020 | $1,655 | $19,933 | $2,641 | $17,292 |
| 2019 | $1,620 | $19,933 | $2,641 | $17,292 |
| 2018 | $1,380 | $17,333 | $2,114 | $15,219 |
| 2017 | $1,302 | $17,333 | $2,114 | $15,219 |
| 2016 | $1,302 | $16,266 | $1,626 | $14,640 |
| 2014 | $1,306 | $16,266 | $1,626 | $14,640 |
Source: Public Records
Map
Nearby Homes
- 6133 Swope Pkwy
- 3874 E 63rd St
- 6101 Swope Pkwy
- 4204 E 60th Terrace
- 4225 E 60th Terrace
- 3821 E 59th Terrace
- 3408 E 62nd St
- 6133 Indiana Ave
- 5938 Kensington Ave
- 5936 Kensington Ave
- 4280 E 62nd St
- 6220 Indiana Ave
- 5907 Jackson Ave
- 4279 E 60 Terrace
- 6328 Indiana Ave
- 4527 E 60th St
- 3821 E 58th Terrace
- 3207 E 62nd St
- 6013 College Ave
- 5829 Jackson Ave
- 3839 E 62nd St Unit B
- 3839 E 62nd St
- 3829 E 62nd St
- 3843 E 62nd St
- 3847 E 62nd St
- 3825 E 62nd St
- 3823 E 62nd St
- 3849 E 62nd St
- 3850 E 62nd St
- 3819 E 62nd St
- 3824 E 62nd St
- 3852 E 62nd St
- 3808 E 62nd St
- 3813 E 62nd St
- 3854 E 62nd St
- 3855 E 62nd St
- 3809 E 62nd St
- 3806 E 62nd St
- 3858 E 62nd St
- 6211 Swope Pkwy