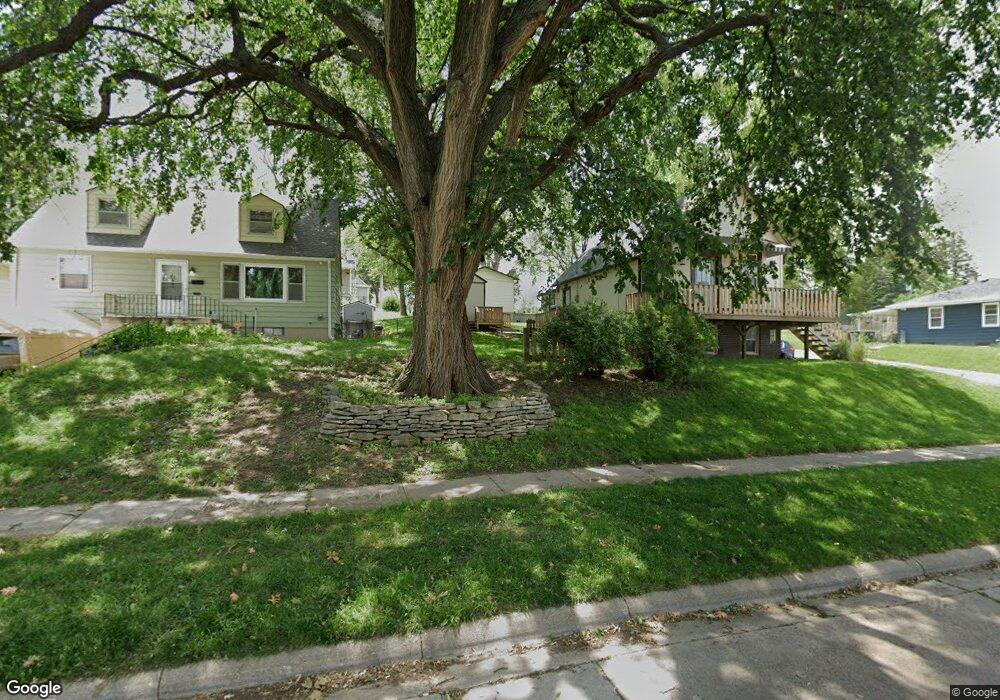
3839 Monroe St Omaha, NE 68107
South Central Omaha NeighborhoodEstimated Value: $136,000 - $160,843
1
Bed
2
Baths
900
Sq Ft
$167/Sq Ft
Est. Value
About This Home
This home is located at 3839 Monroe St, Omaha, NE 68107 and is currently estimated at $150,711, approximately $167 per square foot. 3839 Monroe St is a home located in Douglas County with nearby schools including Gilder Elementary School, Bryan Middle School, and Bryan High School.
Ownership History
Date
Name
Owned For
Owner Type
Purchase Details
Closed on
Apr 14, 2017
Sold by
Just Enough Properties Llc
Bought by
Richter Regina Marie
Current Estimated Value
Home Financials for this Owner
Home Financials are based on the most recent Mortgage that was taken out on this home.
Original Mortgage
$71,186
Outstanding Balance
$59,270
Interest Rate
4.23%
Mortgage Type
FHA
Estimated Equity
$91,441
Purchase Details
Closed on
May 9, 2013
Sold by
Guy Jamie L
Bought by
Just Enough Properties Llc
Purchase Details
Closed on
Sep 9, 2009
Sold by
Broussard David P and Boucher Lori Jane
Bought by
Guy Jamie L
Create a Home Valuation Report for This Property
The Home Valuation Report is an in-depth analysis detailing your home's value as well as a comparison with similar homes in the area
Home Values in the Area
Average Home Value in this Area
Purchase History
| Date | Buyer | Sale Price | Title Company |
|---|---|---|---|
| Richter Regina Marie | $73,000 | Stewart Title Co | |
| Just Enough Properties Llc | -- | None Available | |
| Guy Jamie L | $20,000 | None Available |
Source: Public Records
Mortgage History
| Date | Status | Borrower | Loan Amount |
|---|---|---|---|
| Open | Richter Regina Marie | $71,186 |
Source: Public Records
Tax History Compared to Growth
Tax History
| Year | Tax Paid | Tax Assessment Tax Assessment Total Assessment is a certain percentage of the fair market value that is determined by local assessors to be the total taxable value of land and additions on the property. | Land | Improvement |
|---|---|---|---|---|
| 2024 | $2,025 | $111,900 | $10,400 | $101,500 |
| 2023 | $2,025 | $96,000 | $10,400 | $85,600 |
| 2022 | $1,960 | $91,800 | $6,200 | $85,600 |
| 2021 | $1,949 | $92,100 | $6,200 | $85,900 |
| 2020 | $1,972 | $92,100 | $6,200 | $85,900 |
| 2019 | $1,802 | $83,900 | $6,200 | $77,700 |
| 2018 | $1,350 | $62,800 | $6,200 | $56,600 |
| 2017 | $1,357 | $62,800 | $6,200 | $56,600 |
| 2016 | $966 | $45,000 | $6,200 | $38,800 |
| 2015 | $953 | $45,000 | $6,200 | $38,800 |
| 2014 | $953 | $45,000 | $6,200 | $38,800 |
Source: Public Records
Map
Nearby Homes