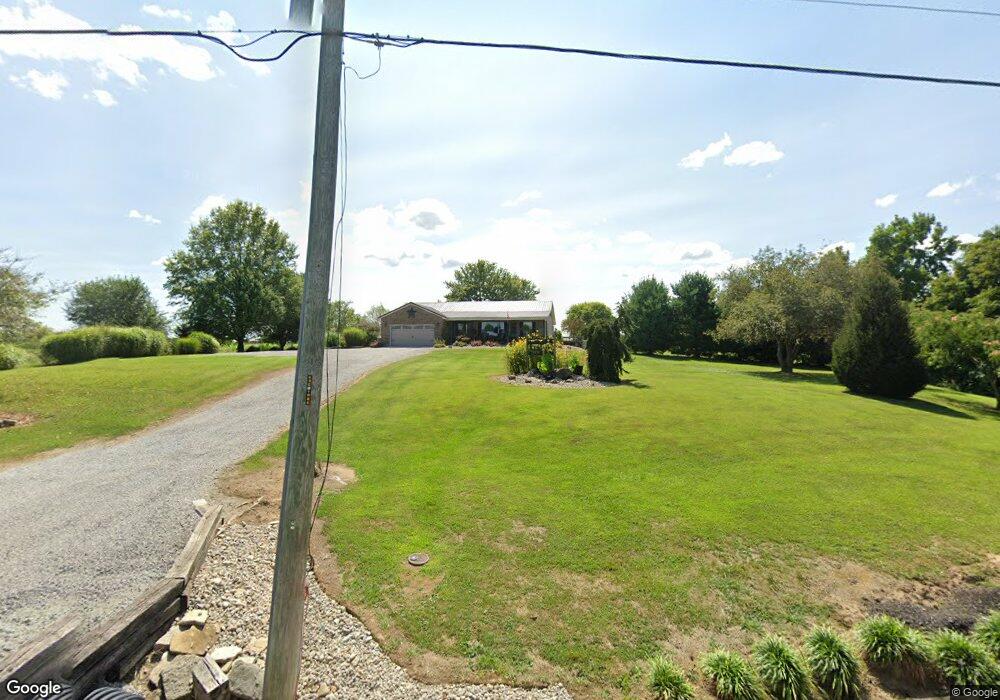
3839 State Route 756 Felicity, OH 45120
Estimated Value: $203,000 - $344,000
3
Beds
2
Baths
1,606
Sq Ft
$180/Sq Ft
Est. Value
About This Home
This home is located at 3839 State Route 756, Felicity, OH 45120 and is currently estimated at $289,016, approximately $179 per square foot. 3839 State Route 756 is a home located in Clermont County with nearby schools including Felicity-Franklin Local Elementary School, Felicity-Franklin Local Middle School, and Felicity-Franklin Local High School.
Ownership History
Date
Name
Owned For
Owner Type
Purchase Details
Closed on
Apr 16, 2019
Sold by
Trammell Tina and Blackburn Jeffrey D
Bought by
Blackburn Tina M and Blackburn Jeffrey D
Current Estimated Value
Purchase Details
Closed on
Apr 13, 2005
Sold by
Trammel Ralph M
Bought by
Trammel Tina M
Home Financials for this Owner
Home Financials are based on the most recent Mortgage that was taken out on this home.
Original Mortgage
$130,000
Outstanding Balance
$61,439
Interest Rate
4.5%
Mortgage Type
Purchase Money Mortgage
Estimated Equity
$227,577
Purchase Details
Closed on
Oct 15, 1998
Sold by
Jarman John K
Bought by
Trammell Ralph M and Trammell Tina
Home Financials for this Owner
Home Financials are based on the most recent Mortgage that was taken out on this home.
Original Mortgage
$96,800
Interest Rate
6.75%
Mortgage Type
New Conventional
Create a Home Valuation Report for This Property
The Home Valuation Report is an in-depth analysis detailing your home's value as well as a comparison with similar homes in the area
Home Values in the Area
Average Home Value in this Area
Purchase History
| Date | Buyer | Sale Price | Title Company |
|---|---|---|---|
| Blackburn Tina M | -- | None Available | |
| Trammel Tina M | -- | -- | |
| Trammell Ralph M | $20,000 | -- |
Source: Public Records
Mortgage History
| Date | Status | Borrower | Loan Amount |
|---|---|---|---|
| Open | Trammel Tina M | $130,000 | |
| Previous Owner | Trammell Ralph M | $96,800 |
Source: Public Records
Tax History Compared to Growth
Tax History
| Year | Tax Paid | Tax Assessment Tax Assessment Total Assessment is a certain percentage of the fair market value that is determined by local assessors to be the total taxable value of land and additions on the property. | Land | Improvement |
|---|---|---|---|---|
| 2024 | $2,495 | $75,710 | $12,390 | $63,320 |
| 2023 | $2,514 | $75,710 | $12,390 | $63,320 |
| 2022 | $2,298 | $63,040 | $10,120 | $52,920 |
| 2021 | $2,301 | $63,040 | $10,120 | $52,920 |
| 2020 | $2,295 | $63,040 | $10,120 | $52,920 |
| 2019 | $2,296 | $60,170 | $9,940 | $50,230 |
| 2018 | $2,298 | $60,170 | $9,940 | $50,230 |
| 2017 | $2,363 | $60,170 | $9,940 | $50,230 |
| 2016 | $1,970 | $48,130 | $7,950 | $40,180 |
| 2015 | $1,829 | $48,130 | $7,950 | $40,180 |
| 2014 | $1,829 | $48,130 | $7,950 | $40,180 |
| 2013 | $1,989 | $49,430 | $9,910 | $39,520 |
Source: Public Records
Map
Nearby Homes
- 650 Ohio 756
- 1606 Lenroot Rd
- 7809 Ohio 505
- 1630 Trisler Rd
- 3569 Smyrna Rd
- 1504 Feesburg-Poetown Rd
- 0 Black Oak Ln
- 403 Felicity Higginsport Rd
- 1921 Bethel Maple Rd
- 7.43 Ac Swope Rd
- 1679 Swope Rd
- 104 Country Way Ln
- 1614 Ohio 133
- 1619 Ohio 133
- 1308 Skiffsville Rd
- 3202 Beech Rd
- 3299 Ohio 756
- 714 West St
- 715 Walnut St
- ac Beech Rd
- 5.81ac Griffith Rd
- 3843 State Route 756
- 3835 State Route 756
- 3835 State Route 756
- 3847 State Route 756
- 3847 State Route 756
- 8073 Griffith Rd
- 536 State Route 756
- 536 State Route 756
- 550 State Route 756
- 554 State Route 756
- 554 St Rt 756
- 3817 State Route 756
- 3817 State Route 756
- 682 Ohio 756
- 684 State Route 756
- 3813 State Route 756
- 660 State Route 756
- 670 State Route 756
- 670 State Route 756