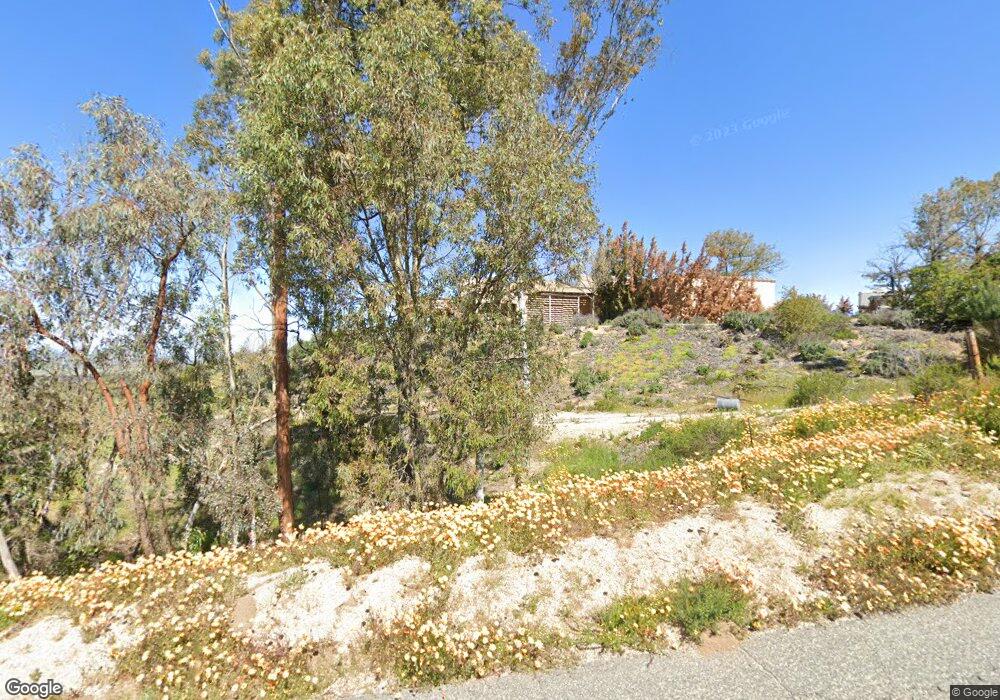
38390 Calaveras Rd Temecula, CA 92592
Estimated Value: $1,178,872 - $1,569,000
3
Beds
3
Baths
3,170
Sq Ft
$448/Sq Ft
Est. Value
About This Home
This home is located at 38390 Calaveras Rd, Temecula, CA 92592 and is currently estimated at $1,418,718, approximately $447 per square foot. 38390 Calaveras Rd is a home located in Riverside County with nearby schools including Crowne Hill Elementary School, Temecula Middle School, and Temecula Valley High School.
Ownership History
Date
Name
Owned For
Owner Type
Purchase Details
Closed on
Jan 19, 2006
Sold by
Radtke Otto H and Radtke Karin G
Bought by
Radtke Otto H and Radtke Karin G
Current Estimated Value
Purchase Details
Closed on
May 10, 1999
Sold by
Gold Alyce Ann
Bought by
Kennedy Diane
Home Financials for this Owner
Home Financials are based on the most recent Mortgage that was taken out on this home.
Original Mortgage
$120,000
Outstanding Balance
$30,285
Interest Rate
7%
Mortgage Type
Purchase Money Mortgage
Estimated Equity
$1,388,433
Purchase Details
Closed on
Apr 5, 1999
Sold by
Kennedy Diane
Bought by
Radtke Otto H and Radtke Karin G
Home Financials for this Owner
Home Financials are based on the most recent Mortgage that was taken out on this home.
Original Mortgage
$120,000
Outstanding Balance
$30,285
Interest Rate
7%
Mortgage Type
Purchase Money Mortgage
Estimated Equity
$1,388,433
Purchase Details
Closed on
Jul 11, 1998
Sold by
Meyer Shragg
Bought by
Shragg Meyer S
Create a Home Valuation Report for This Property
The Home Valuation Report is an in-depth analysis detailing your home's value as well as a comparison with similar homes in the area
Purchase History
| Date | Buyer | Sale Price | Title Company |
|---|---|---|---|
| Radtke Otto H | -- | None Available | |
| Kennedy Diane | -- | Stewart Title Company | |
| Radtke Otto H | $345,000 | Stewart Title Company | |
| Shragg Meyer S | -- | -- |
Source: Public Records
Mortgage History
| Date | Status | Borrower | Loan Amount |
|---|---|---|---|
| Open | Radtke Otto H | $120,000 |
Source: Public Records
Tax History
| Year | Tax Paid | Tax Assessment Tax Assessment Total Assessment is a certain percentage of the fair market value that is determined by local assessors to be the total taxable value of land and additions on the property. | Land | Improvement |
|---|---|---|---|---|
| 2025 | $5,760 | $536,912 | $125,399 | $411,513 |
| 2023 | $5,760 | $516,066 | $120,531 | $395,535 |
| 2022 | $5,594 | $505,948 | $118,168 | $387,780 |
| 2021 | $5,484 | $496,028 | $115,851 | $380,177 |
| 2020 | $5,427 | $490,943 | $114,664 | $376,279 |
| 2019 | $5,346 | $481,317 | $112,416 | $368,901 |
| 2018 | $5,247 | $471,880 | $110,212 | $361,668 |
| 2017 | $5,154 | $462,628 | $108,051 | $354,577 |
| 2016 | $5,047 | $453,558 | $105,933 | $347,625 |
| 2015 | $4,955 | $446,747 | $104,343 | $342,404 |
| 2014 | $4,809 | $437,998 | $102,300 | $335,698 |
Source: Public Records
Map
Nearby Homes
- 38975 Via de Oro
- 38525 Via de Oro
- 39275 Chaparral Dr
- 37985 Avenida Bravura
- 39968 Calle Breve
- 0 Bruce Ln Unit 20105958
- 0 Bruce Ln Unit SW24072105
- 0 Via de Oro Unit NDP2509834
- 1 Esplendida Way
- 3 Esplendida Way
- 4 Esplendida Way
- 39220 Gray Squirrel Rd
- 39780 Cushman Cir
- 0 Air Park Dr Unit IV25243090
- 0 Calle Breve Unit SW25274674
- 0 Calle Breve Unit SW25274667
- 0 Calle Breve Unit SW25274684
- 39365 Calle Breve
- 39475 Bruce Ln
- 39775 Calle Bellagio
- 39495 Via de Oro
- 38475 Calaveras Rd
- 38355 Calaveras Rd
- 40160 Via Verano
- 11 Esplendida Way
- 47 Esplendida Way
- 46 Esplendida Way
- 45 Esplendida Way
- 44 Esplendida Way
- 15 Esplendida Way
- 0 Esplendida Way
- 00 Esplendida Way
- 0 Esplendida Way Unit CRSW24230425
- 0 Esplendida Way Unit CRIV24038264
- 0 Esplendida Way Unit SW24230425
- 0 Esplendida Way Unit IV24038264
- 0 Esplendida Way Unit SW22098313
- 0 Esplendida Way Unit IV22032811
- 0 Esplendida Way Unit SW19213099
- 0 Esplendida Way Unit 13-693149
Your Personal Tour Guide
Ask me questions while you tour the home.