384 Avenida de Amigos Nipomo, CA 93444
Estimated Value: $519,000 - $625,000
--
Bed
3
Baths
1,300
Sq Ft
$431/Sq Ft
Est. Value
About This Home
This home is located at 384 Avenida de Amigos, Nipomo, CA 93444 and is currently estimated at $559,754, approximately $430 per square foot. 384 Avenida de Amigos is a home located in San Luis Obispo County with nearby schools including Dana Elementary School, Mesa Middle School, and Nipomo High School.
Ownership History
Date
Name
Owned For
Owner Type
Purchase Details
Closed on
Oct 21, 2011
Sold by
First California Bank
Bought by
Cal Coast Investment L P
Current Estimated Value
Home Financials for this Owner
Home Financials are based on the most recent Mortgage that was taken out on this home.
Original Mortgage
$1,440,000
Outstanding Balance
$981,662
Interest Rate
4.09%
Mortgage Type
Construction
Estimated Equity
-$421,908
Purchase Details
Closed on
Jun 30, 2011
Sold by
Moriarty Realty Properties Inc
Bought by
First California Bank
Purchase Details
Closed on
Dec 10, 2007
Sold by
22 Amigos Llc
Bought by
Moriarty Realty Properties Inc
Home Financials for this Owner
Home Financials are based on the most recent Mortgage that was taken out on this home.
Original Mortgage
$4,880,000
Interest Rate
6.26%
Mortgage Type
Purchase Money Mortgage
Create a Home Valuation Report for This Property
The Home Valuation Report is an in-depth analysis detailing your home's value as well as a comparison with similar homes in the area
Home Values in the Area
Average Home Value in this Area
Purchase History
| Date | Buyer | Sale Price | Title Company |
|---|---|---|---|
| Cal Coast Investment L P | $2,400,000 | Fidelity National Title Co | |
| First California Bank | $2,550,000 | None Available | |
| Moriarty Realty Properties Inc | $4,880,000 | First American Title Co |
Source: Public Records
Mortgage History
| Date | Status | Borrower | Loan Amount |
|---|---|---|---|
| Open | Cal Coast Investment L P | $1,440,000 | |
| Previous Owner | Moriarty Realty Properties Inc | $4,880,000 |
Source: Public Records
Tax History Compared to Growth
Tax History
| Year | Tax Paid | Tax Assessment Tax Assessment Total Assessment is a certain percentage of the fair market value that is determined by local assessors to be the total taxable value of land and additions on the property. | Land | Improvement |
|---|---|---|---|---|
| 2025 | $1,938 | $188,398 | $56,518 | $131,880 |
| 2024 | $1,916 | $184,705 | $55,410 | $129,295 |
| 2023 | $1,916 | $181,084 | $54,324 | $126,760 |
| 2022 | $1,887 | $177,534 | $53,259 | $124,275 |
| 2021 | $1,883 | $174,054 | $52,215 | $121,839 |
| 2020 | $1,862 | $172,270 | $51,680 | $120,590 |
| 2019 | $1,850 | $168,893 | $50,667 | $118,226 |
| 2018 | $1,828 | $165,582 | $49,674 | $115,908 |
| 2017 | $1,794 | $162,336 | $48,700 | $113,636 |
| 2016 | $1,692 | $159,154 | $47,746 | $111,408 |
| 2015 | $1,668 | $156,764 | $47,029 | $109,735 |
| 2014 | $1,606 | $153,694 | $46,108 | $107,586 |
Source: Public Records
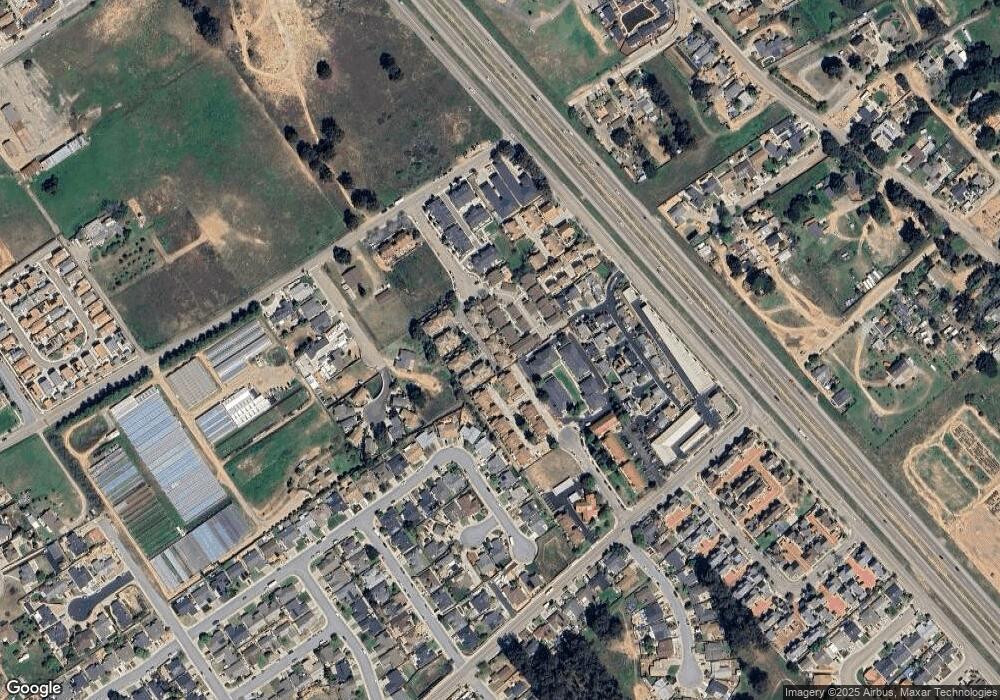
Map
Nearby Homes
- 368 Avenida de Amigos
- 450 Avenida de Socios Unit 12
- 525 Grande Ave Unit D
- 626 Juno Ct
- 232 Scarlett Cir
- Mesa Plan at Hill Street Terraces - Hill Street Series
- Pacific Plan at Hill Street Terraces - Hill Street Series
- Monarch Plan at Hill Street Terraces - Hill Street Series
- Rancho Plan at Hill Street Terraces - Hill Street Series
- Dana Plan at Hill Street Terraces - Hill Street Series
- 483 Violet Ave
- 680 Hill St
- 449 W Tefft St Unit 23
- 449 W Tefft St Unit 13
- 725 Monarch Ln
- 424 Bermuda Place
- 522 Higos Way
- 719 W Tefft St
- 160 San Antonio Ln
- 90111003 W Price St
- 382 Avenida de Amigos
- 386 Avenida de Amigos
- 380 Avenida de Amigos
- 390 Avenida de Amigos
- 391 Avenida de Amigos
- 450 Avenida de Socios
- 450 Avenida de Socios Unit 11
- 450 Avenida de Socios Unit 10
- 450 Avenida de Socios Unit 9
- 450 Avenida de Socios Unit 8
- 450 Avenida de Socios Unit 7
- 450 Avenida de Socios Unit 6
- 450 Avenida de Socios Unit 5
- 450 Avenida de Socios Unit 4
- 450 Avenida de Socios Unit 3
- 450 Avenida de Socios Unit 1
- 366 Avenida de Amigos
- 376 Avenida de Amigos
- 392 Avenida de Amigos
- 374 Avenida de Amigos