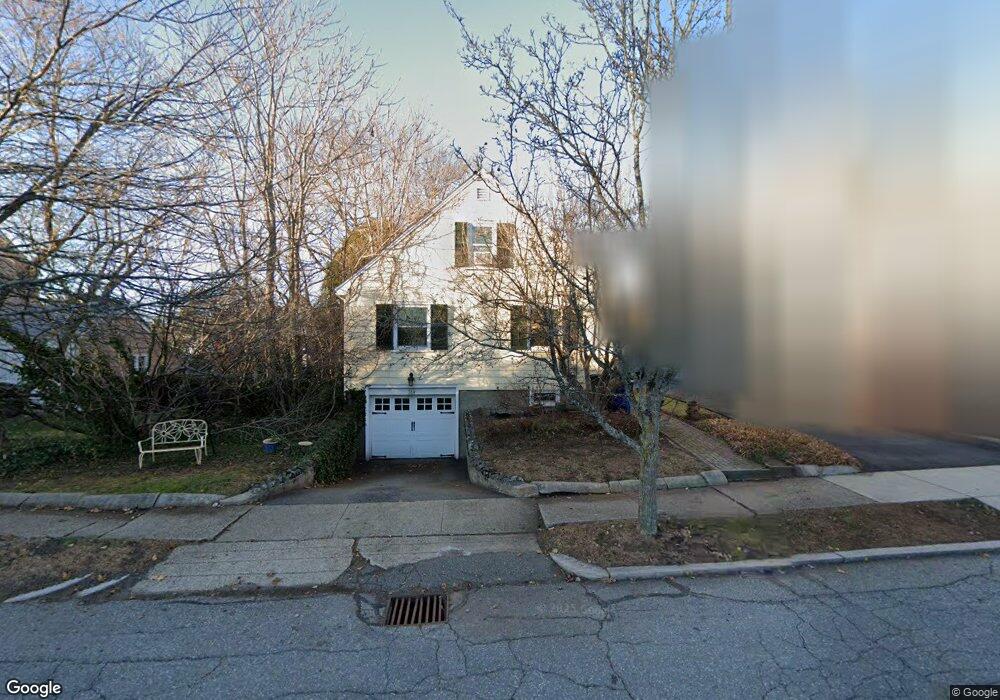
384 E Foster St Melrose, MA 02176
Melrose East Side NeighborhoodEstimated Value: $741,000 - $909,000
3
Beds
2
Baths
1,482
Sq Ft
$569/Sq Ft
Est. Value
About This Home
This home is located at 384 E Foster St, Melrose, MA 02176 and is currently estimated at $843,693, approximately $569 per square foot. 384 E Foster St is a home located in Middlesex County with nearby schools including Winthrop Elementary School, Hoover Elementary School, and Horace Mann Elementary School.
Ownership History
Date
Name
Owned For
Owner Type
Purchase Details
Closed on
Jun 3, 2011
Sold by
Bennett Leah M and Bennett Gary
Bought by
Bartholet Carolyn
Current Estimated Value
Purchase Details
Closed on
Jan 18, 2005
Sold by
Messenger Katherine P
Bought by
Bennett Gary and Bennett Leah Moore
Home Financials for this Owner
Home Financials are based on the most recent Mortgage that was taken out on this home.
Original Mortgage
$360,700
Interest Rate
5.81%
Mortgage Type
Purchase Money Mortgage
Purchase Details
Closed on
Nov 30, 2000
Sold by
Davis Anthony and Nassif Carole E
Bought by
Messenger Katherine P
Home Financials for this Owner
Home Financials are based on the most recent Mortgage that was taken out on this home.
Original Mortgage
$125,000
Interest Rate
7.76%
Mortgage Type
Purchase Money Mortgage
Create a Home Valuation Report for This Property
The Home Valuation Report is an in-depth analysis detailing your home's value as well as a comparison with similar homes in the area
Home Values in the Area
Average Home Value in this Area
Purchase History
We collect this data history from publicly available records. To have your information removed, we recommend requesting removal directly through your county’s website.
| Date | Buyer | Sale Price | Title Company |
|---|---|---|---|
| Bartholet Carolyn | $394,000 | -- | |
| Bennett Gary | $450,900 | -- | |
| Messenger Katherine P | $319,900 | -- |
Source: Public Records
Mortgage History
We collect this data history from publicly available records. To have your information removed, we recommend requesting removal directly through your county’s website.
| Date | Status | Borrower | Loan Amount |
|---|---|---|---|
| Previous Owner | Bennett Gary | $360,700 | |
| Previous Owner | Messenger Katherine P | $125,000 | |
| Previous Owner | Messenger Katherine P | $100,000 | |
| Previous Owner | Messenger Katherine P | $56,500 |
Source: Public Records
Tax History
| Year | Tax Paid | Tax Assessment Tax Assessment Total Assessment is a certain percentage of the fair market value that is determined by local assessors to be the total taxable value of land and additions on the property. | Land | Improvement |
|---|---|---|---|---|
| 2025 | $75 | $754,700 | $445,300 | $309,400 |
| 2024 | $7,122 | $717,200 | $418,300 | $298,900 |
| 2023 | $7,136 | $684,800 | $404,800 | $280,000 |
| 2022 | $7,145 | $676,000 | $404,800 | $271,200 |
| 2021 | $6,831 | $623,800 | $377,800 | $246,000 |
| 2020 | $6,447 | $583,400 | $337,300 | $246,100 |
| 2019 | $5,747 | $531,600 | $311,700 | $219,900 |
| 2018 | $5,702 | $503,300 | $283,400 | $219,900 |
| 2017 | $5,573 | $472,300 | $269,900 | $202,400 |
| 2016 | $5,614 | $455,300 | $263,100 | $192,200 |
| 2015 | $5,259 | $405,800 | $236,100 | $169,700 |
| 2014 | $5,032 | $378,900 | $209,200 | $169,700 |
Source: Public Records
Map
Nearby Homes
- 29 East St
- 21 Vista St
- 228 Upham St
- 26 Garfield Rd
- 34 Russett Ln
- 56 Orchard Ln
- 71-73 Grove St
- 639 Lynn Fells Pkwy
- 646 Lynn Fells Pkwy
- 12 Stevens Place
- 29 Hammersmith Dr
- 8 Crystal St Unit 2
- 8 Crystal St Unit 3
- 247 Lebanon St
- 31 Temple St
- 161 Green St
- 534 Main St Unit 11
- 180 Green St Unit 101
- 25 Naples Rd
- 2102 Lewis o Gray Dr
Your Personal Tour Guide
Ask me questions while you tour the home.