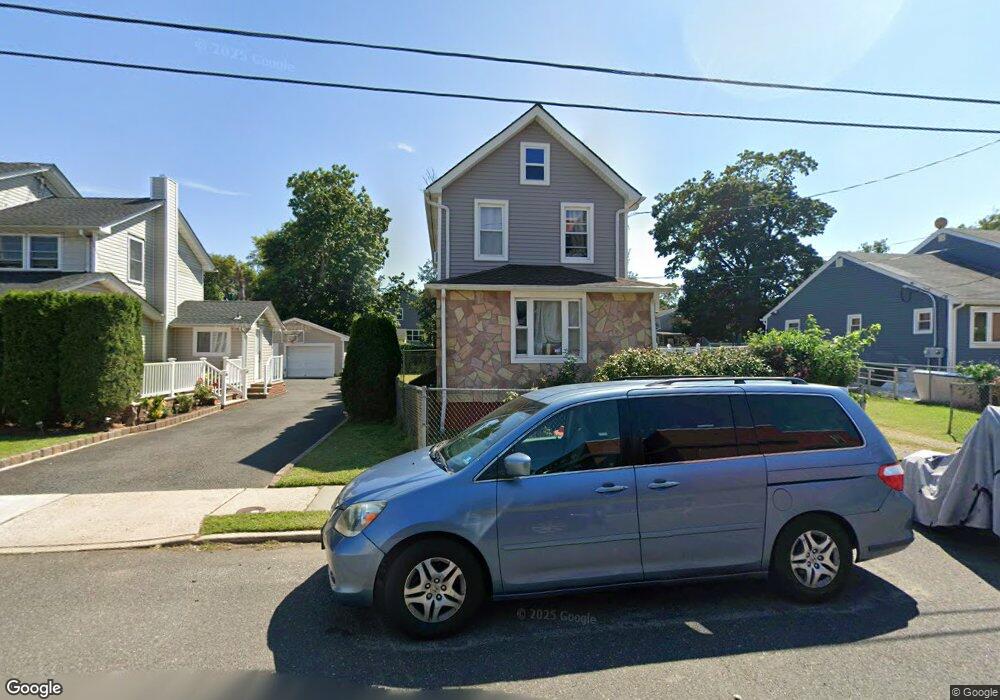
384 Hendrickson Ave Long Branch, NJ 07740
Estimated Value: $472,000 - $545,000
3
Beds
2
Baths
1,376
Sq Ft
$370/Sq Ft
Est. Value
About This Home
This home is located at 384 Hendrickson Ave, Long Branch, NJ 07740 and is currently estimated at $508,897, approximately $369 per square foot. 384 Hendrickson Ave is a home located in Monmouth County with nearby schools including Long Branch High School and Holy Trinity School.
Ownership History
Date
Name
Owned For
Owner Type
Purchase Details
Closed on
May 27, 2011
Sold by
Moran Monica and Moran Harold
Bought by
Monroy Groelfi Collazos
Current Estimated Value
Home Financials for this Owner
Home Financials are based on the most recent Mortgage that was taken out on this home.
Original Mortgage
$139,127
Outstanding Balance
$96,405
Interest Rate
4.74%
Mortgage Type
FHA
Estimated Equity
$412,492
Purchase Details
Closed on
Jan 28, 2006
Sold by
Tillison Inez
Bought by
Moran Monica
Home Financials for this Owner
Home Financials are based on the most recent Mortgage that was taken out on this home.
Original Mortgage
$67,500
Interest Rate
5.71%
Mortgage Type
Stand Alone Second
Create a Home Valuation Report for This Property
The Home Valuation Report is an in-depth analysis detailing your home's value as well as a comparison with similar homes in the area
Home Values in the Area
Average Home Value in this Area
Purchase History
| Date | Buyer | Sale Price | Title Company |
|---|---|---|---|
| Monroy Groelfi Collazos | $145,000 | Golden Title Agency | |
| Moran Monica | $270,000 | -- |
Source: Public Records
Mortgage History
| Date | Status | Borrower | Loan Amount |
|---|---|---|---|
| Open | Monroy Groelfi Collazos | $139,127 | |
| Previous Owner | Moran Monica | $67,500 | |
| Previous Owner | Moran Monica | $202,500 |
Source: Public Records
Tax History
| Year | Tax Paid | Tax Assessment Tax Assessment Total Assessment is a certain percentage of the fair market value that is determined by local assessors to be the total taxable value of land and additions on the property. | Land | Improvement |
|---|---|---|---|---|
| 2025 | $4,837 | $395,000 | $199,400 | $195,600 |
| 2024 | $4,600 | $314,700 | $127,600 | $187,100 |
| 2023 | $4,600 | $296,200 | $117,600 | $178,600 |
| 2022 | $4,206 | $237,000 | $79,700 | $157,300 |
| 2021 | $4,206 | $219,800 | $72,700 | $147,100 |
| 2020 | $4,347 | $208,000 | $61,700 | $146,300 |
| 2019 | $4,187 | $199,200 | $59,700 | $139,500 |
| 2018 | $4,061 | $192,100 | $57,700 | $134,400 |
| 2017 | $3,906 | $189,500 | $57,700 | $131,800 |
| 2016 | $3,802 | $188,100 | $59,700 | $128,400 |
| 2015 | $3,922 | $176,100 | $63,700 | $112,400 |
| 2014 | $3,662 | $173,300 | $73,500 | $99,800 |
Source: Public Records
Map
Nearby Homes
- 134 Lippincott Ave
- 401 Joline Ave
- 117 Laurel St
- 139 Sixth Ave
- 267 N 5th Ave
- 282 Rockwell Ave
- 40 N 5th Ave
- 428 Atlantic Ave
- 40 University Dr
- 395 Broadway
- 236 Seaview Ave
- 516 Atlantic Ave
- 75 Washington St
- 25 Community Place
- 66 Seneca Place
- 68 Seneca Place
- 631 Irving Place
- 150 Sampson Place
- 219 Long Branch Ave
- 172 Chelton Ave
- 394 Hendrickson Ave
- 376 Hendrickson Ave
- 396 Hendrickson Ave
- 128 Lippincott Ave
- 385 Brinley St
- 124 Lippincott Ave
- 387 Brinley St
- 381 Brinley St
- 132 Lippincott Ave
- 391 Brinley St
- 120 Lippincott Ave
- 377 Hendrickson Ave
- 400 Hendrickson Ave
- 402 Hendrickson Ave
- 116 Lippincott Ave
- 395 Brinley St
- 136 Lippincott Ave
- 399 Brinley St
- 127 Lippincott Ave
- 404 Hendrickson Ave
Your Personal Tour Guide
Ask me questions while you tour the home.