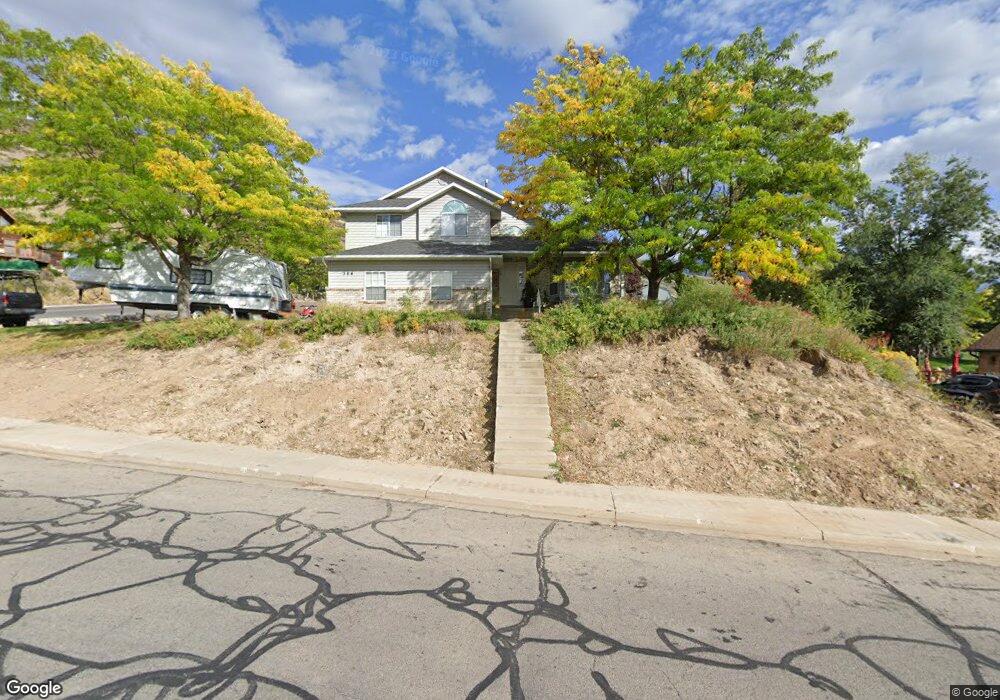
384 N 835 E Lindon, UT 84042
Estimated Value: $665,000 - $745,000
4
Beds
4
Baths
2,429
Sq Ft
$287/Sq Ft
Est. Value
About This Home
This home is located at 384 N 835 E, Lindon, UT 84042 and is currently estimated at $697,079, approximately $286 per square foot. 384 N 835 E is a home located in Utah County with nearby schools including Lindon Elementary School, Oak Canyon Junior High School, and Pleasant Grove High School.
Ownership History
Date
Name
Owned For
Owner Type
Purchase Details
Closed on
Jun 24, 2020
Sold by
Brandt Mark D
Bought by
Brandt Mark David
Current Estimated Value
Home Financials for this Owner
Home Financials are based on the most recent Mortgage that was taken out on this home.
Original Mortgage
$257,000
Outstanding Balance
$204,538
Interest Rate
3.2%
Mortgage Type
New Conventional
Estimated Equity
$492,541
Purchase Details
Closed on
Jun 29, 2015
Sold by
Jarrett Rose Ann and Rose Ann Jarrett Revocable Liv
Bought by
Barndt Mark D
Home Financials for this Owner
Home Financials are based on the most recent Mortgage that was taken out on this home.
Original Mortgage
$272,650
Interest Rate
4.01%
Mortgage Type
New Conventional
Purchase Details
Closed on
Mar 14, 2002
Sold by
Orton Kevin W and Orton Michelle
Bought by
Utah Valley Financial Llc
Create a Home Valuation Report for This Property
The Home Valuation Report is an in-depth analysis detailing your home's value as well as a comparison with similar homes in the area
Home Values in the Area
Average Home Value in this Area
Purchase History
| Date | Buyer | Sale Price | Title Company |
|---|---|---|---|
| Brandt Mark David | -- | Trident Title Ins Agcy Llc | |
| Barndt Mark D | -- | Morgan Title & Escrow Inc | |
| Utah Valley Financial Llc | -- | -- |
Source: Public Records
Mortgage History
| Date | Status | Borrower | Loan Amount |
|---|---|---|---|
| Open | Brandt Mark David | $257,000 | |
| Closed | Barndt Mark D | $272,650 |
Source: Public Records
Tax History
| Year | Tax Paid | Tax Assessment Tax Assessment Total Assessment is a certain percentage of the fair market value that is determined by local assessors to be the total taxable value of land and additions on the property. | Land | Improvement |
|---|---|---|---|---|
| 2025 | $2,338 | $313,995 | -- | -- |
| 2024 | $2,338 | $288,200 | $0 | $0 |
| 2023 | $2,191 | $290,070 | $0 | $0 |
| 2022 | $2,380 | $304,480 | $0 | $0 |
| 2021 | $2,133 | $411,300 | $157,500 | $253,800 |
| 2020 | $1,980 | $376,000 | $143,200 | $232,800 |
| 2019 | $1,745 | $345,600 | $143,200 | $202,400 |
| 2018 | $1,747 | $326,200 | $143,200 | $183,000 |
| 2017 | $1,676 | $167,860 | $0 | $0 |
| 2016 | $1,622 | $150,205 | $0 | $0 |
| 2015 | $1,541 | $134,970 | $0 | $0 |
| 2014 | $1,372 | $119,020 | $0 | $0 |
Source: Public Records
Map
Nearby Homes
Your Personal Tour Guide
Ask me questions while you tour the home.