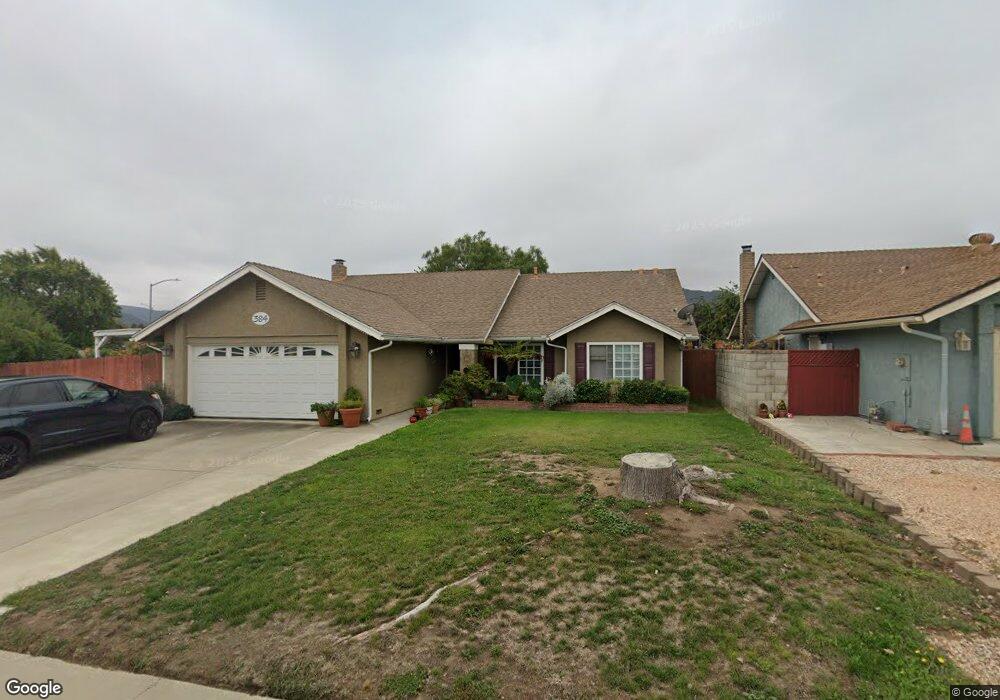
384 Oak Tree Way Buellton, CA 93427
Estimated Value: $895,000 - $1,005,000
3
Beds
2
Baths
1,578
Sq Ft
$604/Sq Ft
Est. Value
About This Home
This home is located at 384 Oak Tree Way, Buellton, CA 93427 and is currently estimated at $953,776, approximately $604 per square foot. 384 Oak Tree Way is a home located in Santa Barbara County with nearby schools including Oak Valley Elementary School, Jonata Middle School, and Santa Ynez Valley Union High School.
Ownership History
Date
Name
Owned For
Owner Type
Purchase Details
Closed on
Mar 11, 2009
Sold by
Lipsky Alan P and Lipsky Rebecca Y
Bought by
Lipsky Alan P and Lipsky Rebecca Y
Current Estimated Value
Home Financials for this Owner
Home Financials are based on the most recent Mortgage that was taken out on this home.
Original Mortgage
$327,000
Outstanding Balance
$206,933
Interest Rate
5.04%
Mortgage Type
New Conventional
Estimated Equity
$746,843
Purchase Details
Closed on
Aug 11, 2008
Sold by
Lipsky Alan P and Lipsky Rebecca Y
Bought by
Lipsky Alan P and Lipsky Rebecca Y
Purchase Details
Closed on
Feb 23, 1998
Sold by
Beltran Martha F and Cecil Beltran Bertha
Bought by
Lipsky Alan P and Lipsky Rebecca Y
Home Financials for this Owner
Home Financials are based on the most recent Mortgage that was taken out on this home.
Original Mortgage
$163,200
Interest Rate
10%
Create a Home Valuation Report for This Property
The Home Valuation Report is an in-depth analysis detailing your home's value as well as a comparison with similar homes in the area
Home Values in the Area
Average Home Value in this Area
Purchase History
| Date | Buyer | Sale Price | Title Company |
|---|---|---|---|
| Lipsky Alan P | -- | First American Title Lenders | |
| Lipsky Alan P | -- | First American Title Lenders | |
| Lipsky Alan P | -- | None Available | |
| Lipsky Alan P | $192,000 | Chicago Title Co |
Source: Public Records
Mortgage History
| Date | Status | Borrower | Loan Amount |
|---|---|---|---|
| Open | Lipsky Alan P | $327,000 | |
| Closed | Lipsky Alan P | $163,200 |
Source: Public Records
Tax History Compared to Growth
Tax History
| Year | Tax Paid | Tax Assessment Tax Assessment Total Assessment is a certain percentage of the fair market value that is determined by local assessors to be the total taxable value of land and additions on the property. | Land | Improvement |
|---|---|---|---|---|
| 2025 | $3,263 | $306,549 | $167,645 | $138,904 |
| 2023 | $3,263 | $294,647 | $161,136 | $133,511 |
| 2022 | $3,156 | $288,871 | $157,977 | $130,894 |
| 2021 | $3,104 | $283,208 | $154,880 | $128,328 |
| 2020 | $3,067 | $280,305 | $153,292 | $127,013 |
| 2019 | $3,013 | $274,810 | $150,287 | $124,523 |
| 2018 | $2,960 | $269,423 | $147,341 | $122,082 |
| 2017 | $2,909 | $264,141 | $144,452 | $119,689 |
| 2016 | $2,799 | $258,963 | $141,620 | $117,343 |
| 2014 | $2,713 | $250,078 | $136,761 | $113,317 |
Source: Public Records
Map
Nearby Homes
- 315 La Lata Dr Unit 103
- 368 Calor Dr
- 367 Calor Dr
- 330 W Highway 246 Unit 225
- 330 W Hwy 246 Unit 51
- 330 W Hwy 246 Unit 64
- 330 W Hwy 246 Unit 54
- 330 W Hwy 246 Unit 148
- 330 W Hwy 246 Unit 24
- 330 W Hwy 246 Unit 225
- 258 Dairyland Rd
- 330 W Highway 246 Unit 17
- 330 W Highway 246 Unit Spc 14
- 415 Arden Ave
- 244 Teri Sue Ln
- 321 Sycamore Dr
- 80 Zaca St Unit 62
- 80 Zaca St Unit Spc 15
- 80 Zaca St Unit 26
- 80 Zaca St Unit 4
- 380 Oak Tree Way
- 376 Oak Tree Way
- 310 Twin Oak Dr
- 320 Twin Oak Dr
- 385 Oak Tree Way
- 381 Oak Tree Way
- 330 Twin Oak Dr
- 377 Oak Tree Way
- 372 Oak Tree Way
- 340 Twin Oak Dr
- 345 Oak Tree Way
- 351 Oak Tree Way
- 355 Oak Tree Way
- 350 Twin Oak Dr
- 350 Twin Oaks
- 368 Oak Tree Way
- 364 Oak Tree Way
- 360 Oak Tree Way
- 356 Oak Tree Way
- 328 Oak Tree Way