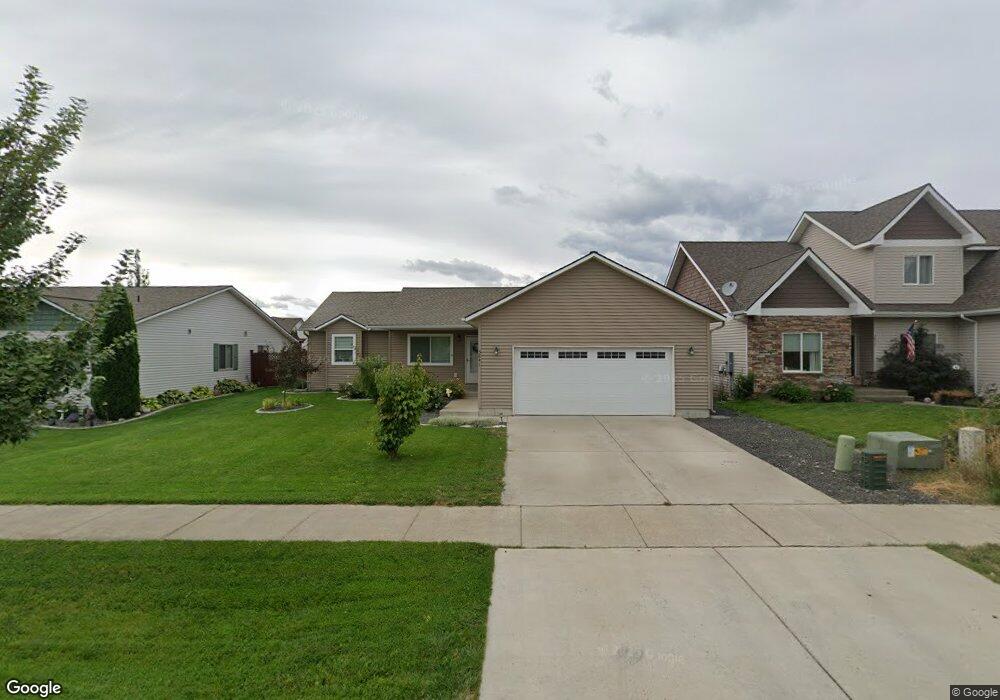
3841 N Maxfli Ln Post Falls, ID 83854
North Prairie NeighborhoodEstimated Value: $428,000 - $447,000
3
Beds
2
Baths
1,310
Sq Ft
$331/Sq Ft
Est. Value
About This Home
This home is located at 3841 N Maxfli Ln, Post Falls, ID 83854 and is currently estimated at $434,243, approximately $331 per square foot. 3841 N Maxfli Ln is a home located in Kootenai County with nearby schools including Mullan Trail Elementary School, River City Middle School, and Post Falls High School.
Ownership History
Date
Name
Owned For
Owner Type
Purchase Details
Closed on
Mar 25, 2021
Sold by
Bell Roseanne
Bought by
Lacroix Gayle and Lacroix Steven
Current Estimated Value
Home Financials for this Owner
Home Financials are based on the most recent Mortgage that was taken out on this home.
Original Mortgage
$289,000
Outstanding Balance
$255,657
Interest Rate
2.73%
Mortgage Type
New Conventional
Estimated Equity
$178,586
Purchase Details
Closed on
Jul 29, 2016
Sold by
Daum William R
Bought by
Bell Roseanne
Home Financials for this Owner
Home Financials are based on the most recent Mortgage that was taken out on this home.
Original Mortgage
$150,000
Interest Rate
3.54%
Mortgage Type
New Conventional
Purchase Details
Closed on
Nov 16, 2015
Sold by
Gw Finance Company Llc
Bought by
Daum William R
Purchase Details
Closed on
Jun 27, 2012
Sold by
Moss Robert A and Moss Robert
Bought by
Gw Gfinace Co Llc
Purchase Details
Closed on
Apr 13, 2006
Sold by
Bluegrass Development Llc
Bought by
J & R Properties Llp
Create a Home Valuation Report for This Property
The Home Valuation Report is an in-depth analysis detailing your home's value as well as a comparison with similar homes in the area
Home Values in the Area
Average Home Value in this Area
Purchase History
| Date | Buyer | Sale Price | Title Company |
|---|---|---|---|
| Lacroix Gayle | -- | Kootenai County Title Co | |
| Lacroix Gayle | -- | Kootenai County Title | |
| Bell Roseanne | -- | North Idaho Title Company | |
| Daum William R | -- | Kootenai County Title Co | |
| Gw Gfinace Co Llc | -- | None Available | |
| J & R Properties Llp | -- | -- |
Source: Public Records
Mortgage History
| Date | Status | Borrower | Loan Amount |
|---|---|---|---|
| Open | Lacroix Gayle | $289,000 | |
| Closed | Lacroix Gayle | $289,000 | |
| Previous Owner | Bell Roseanne | $150,000 |
Source: Public Records
Tax History
| Year | Tax Paid | Tax Assessment Tax Assessment Total Assessment is a certain percentage of the fair market value that is determined by local assessors to be the total taxable value of land and additions on the property. | Land | Improvement |
|---|---|---|---|---|
| 2025 | $2,400 | $397,480 | $158,400 | $239,080 |
| 2024 | $1,529 | $395,870 | $132,000 | $263,870 |
| 2023 | $1,529 | $428,870 | $165,000 | $263,870 |
| 2022 | $2,081 | $459,090 | $153,000 | $306,090 |
| 2021 | $958 | $285,780 | $90,000 | $195,780 |
| 2020 | $2,861 | $251,180 | $70,000 | $181,180 |
| 2019 | $2,663 | $210,550 | $60,000 | $150,550 |
| 2018 | $2,745 | $197,300 | $60,000 | $137,300 |
| 2017 | $2,787 | $183,830 | $50,000 | $133,830 |
| 2016 | $624 | $0 | $0 | $0 |
| 2015 | -- | $35,000 | $35,000 | $0 |
| 2013 | $248 | $29,000 | $29,000 | $0 |
Source: Public Records
Map
Nearby Homes
- 849 W Ashworth Ln
- 12719 W Prairie Ave
- 8256 N Woodworth St
- 1047 W Cordgrass Ave
- 1021 W Cordgrass Ave
- 8236 N Chase Rd
- 1110 W Cordgrass Ave
- 8392 Scotsworth
- 1133 W Cordgrass Ave
- 1207 W Fair Ln
- 276 W Blanton Ave
- 12131 W Moorfield Ave
- 926 W Cordgrass Ave
- 296 W Tennessee Ave
- 8394 N Chase Rd
- 368 W Tennessee Ave
- 109 W Tennessee Ave
- 12095 W Wellington Ave
- 12365 W Renshaw Ave
- 3648 N Blaze Loop
- 3823 N Maxfli Ln
- 3859 N Maxfli Ln
- 3860 N Mashie St
- 3879 N Maxfli Ln
- 3801 N Maxfli Ln
- 3834 N Mashie St
- 3860 N Mashie St
- 3842 N Maxfli Ln
- 3860 N Maxfli Ln
- 3804 N Mashie St
- 3899 N Maxfli Ln
- 3884 N Mashie St
- 3783 N Maxfli Ln
- 3884 N Mashie St
- 3878 N Maxfli Ln
- 3806 N Maxfli Ln
- LOT 6 Maxfli Ln
- 0 Maxfli Ln
- 3788 N Maxfli Ln
- 3894 N Mashie St
Your Personal Tour Guide
Ask me questions while you tour the home.