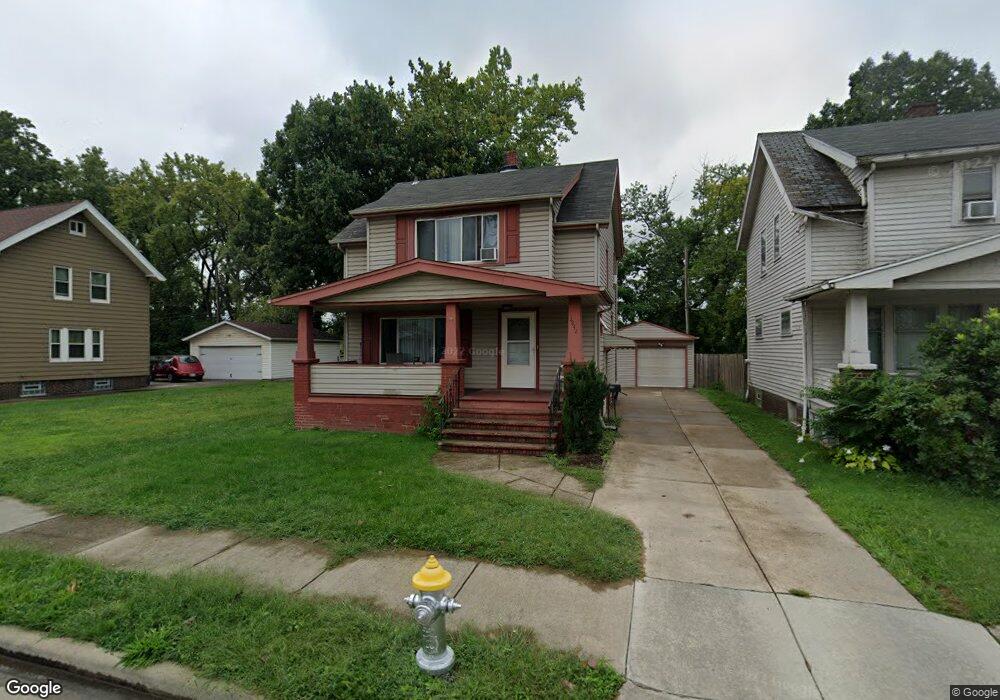
3842 E 38th St Newburgh Heights, OH 44105
Estimated Value: $118,000 - $138,000
3
Beds
1
Bath
1,202
Sq Ft
$107/Sq Ft
Est. Value
About This Home
This home is located at 3842 E 38th St, Newburgh Heights, OH 44105 and is currently estimated at $128,710, approximately $107 per square foot. 3842 E 38th St is a home located in Cuyahoga County with nearby schools including Washington Park Community, Cleveland College Preparatory School, and St Stanislaus School.
Ownership History
Date
Name
Owned For
Owner Type
Purchase Details
Closed on
Oct 2, 2019
Sold by
Mann Paul
Bought by
Mann Paul J and Mann Nancy L
Current Estimated Value
Purchase Details
Closed on
Oct 28, 2008
Sold by
Deutsche Bank National Trust Company
Bought by
Mann David R and Mann Paul
Purchase Details
Closed on
Mar 26, 2008
Sold by
Zuchowski Gerald J and Zuchowski Anne M
Bought by
Deutsche Bank National Trust Co
Purchase Details
Closed on
Apr 21, 1999
Sold by
Jablonski Dorothy A and Jablonski Ronald D
Bought by
Zuchowski Gerald J and Zuchowski Anne M
Home Financials for this Owner
Home Financials are based on the most recent Mortgage that was taken out on this home.
Original Mortgage
$24,500
Interest Rate
7.17%
Mortgage Type
Seller Take Back
Purchase Details
Closed on
Oct 17, 1984
Sold by
Nedved Elmer J and Nedved Ann
Bought by
Nedved Elmer J
Purchase Details
Closed on
Jan 1, 1975
Bought by
Nedved Elmer J and Nedved Ann
Create a Home Valuation Report for This Property
The Home Valuation Report is an in-depth analysis detailing your home's value as well as a comparison with similar homes in the area
Home Values in the Area
Average Home Value in this Area
Purchase History
| Date | Buyer | Sale Price | Title Company |
|---|---|---|---|
| Mann Paul J | -- | None Available | |
| Mann David R | $34,500 | Accutitle Agency Inc | |
| Deutsche Bank National Trust Co | $54,667 | Attorney | |
| Zuchowski Gerald J | $24,500 | -- | |
| Nedved Elmer J | -- | -- | |
| Nedved Elmer J | -- | -- |
Source: Public Records
Mortgage History
| Date | Status | Borrower | Loan Amount |
|---|---|---|---|
| Previous Owner | Zuchowski Gerald J | $24,500 |
Source: Public Records
Tax History
| Year | Tax Paid | Tax Assessment Tax Assessment Total Assessment is a certain percentage of the fair market value that is determined by local assessors to be the total taxable value of land and additions on the property. | Land | Improvement |
|---|---|---|---|---|
| 2024 | $2,733 | $34,090 | $6,440 | $27,650 |
| 2023 | $2,215 | $21,220 | $3,330 | $17,890 |
| 2022 | $2,210 | $21,210 | $3,325 | $17,885 |
| 2021 | $2,194 | $21,210 | $3,330 | $17,890 |
| 2020 | $2,343 | $19,850 | $3,120 | $16,730 |
| 2019 | $2,346 | $56,700 | $8,900 | $47,800 |
| 2018 | $2,221 | $19,850 | $3,120 | $16,730 |
| 2017 | $2,275 | $18,620 | $3,010 | $15,610 |
| 2016 | $2,130 | $18,620 | $3,010 | $15,610 |
| 2015 | $2,272 | $18,620 | $3,010 | $15,610 |
| 2014 | $2,272 | $20,230 | $3,290 | $16,940 |
Source: Public Records
Map
Nearby Homes
- 3628 Beyerle Rd
- 3646 Independence Rd
- 3716 E 50th St
- 3558 E 46th St
- 3690 E 50th St
- 3704 E 52nd St
- 3674 E 52nd St
- 3660 E 53rd St
- 3654 E 53rd St
- 3799 E 54th St
- 5295 Harvard Ave
- 5412 Orey Ave
- 4001 E 54th St
- 3663 E 54th St
- 4017 E 54th St
- 3880 E 57th St
- 3641 E 54th St
- 5806 Fleet Ave
- 4099 E 56th St
- 5005 Dalton Ave
Your Personal Tour Guide
Ask me questions while you tour the home.