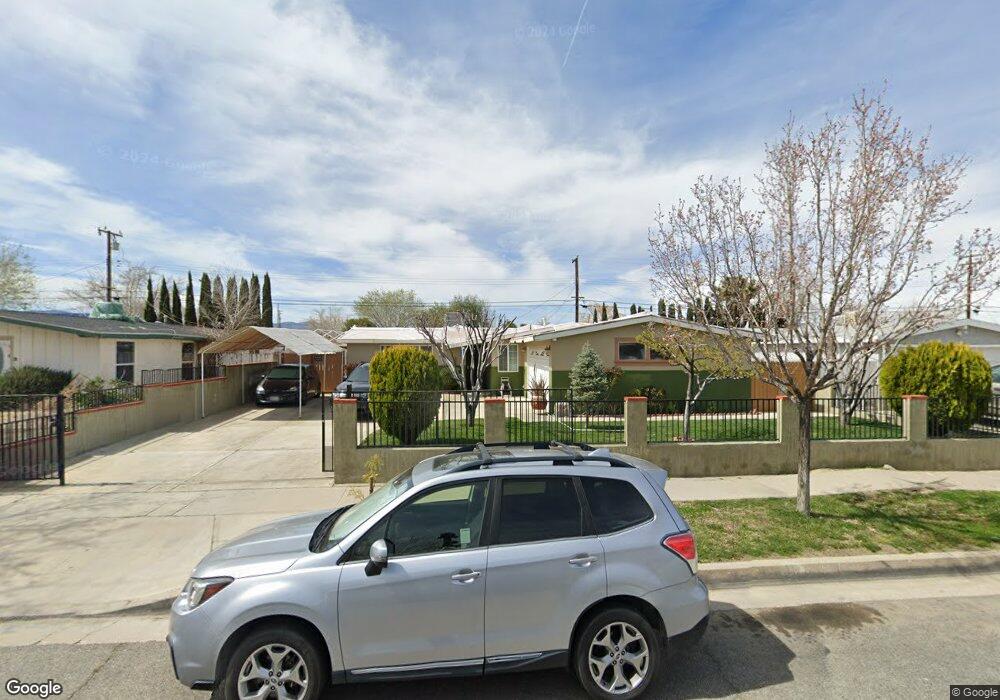
38429 37th St E Palmdale, CA 93550
East Palmdale NeighborhoodEstimated Value: $402,000 - $414,310
4
Beds
2
Baths
1,265
Sq Ft
$322/Sq Ft
Est. Value
About This Home
This home is located at 38429 37th St E, Palmdale, CA 93550 and is currently estimated at $407,328, approximately $321 per square foot. 38429 37th St E is a home located in Los Angeles County with nearby schools including Manzanita Elementary School, Cactus Magnet Academy, and Palmdale High School.
Ownership History
Date
Name
Owned For
Owner Type
Purchase Details
Closed on
Feb 22, 2006
Sold by
David Efrain and Nunez Francisco J
Bought by
Nunez Francisco J
Current Estimated Value
Home Financials for this Owner
Home Financials are based on the most recent Mortgage that was taken out on this home.
Original Mortgage
$203,000
Outstanding Balance
$113,942
Interest Rate
6.15%
Mortgage Type
New Conventional
Estimated Equity
$293,386
Purchase Details
Closed on
Sep 14, 2003
Sold by
David Raquel
Bought by
David Efrain
Home Financials for this Owner
Home Financials are based on the most recent Mortgage that was taken out on this home.
Original Mortgage
$135,703
Interest Rate
6.17%
Mortgage Type
Purchase Money Mortgage
Purchase Details
Closed on
Aug 22, 2003
Sold by
Harris David W and Jester Theresa L
Bought by
David Efrain
Home Financials for this Owner
Home Financials are based on the most recent Mortgage that was taken out on this home.
Original Mortgage
$135,703
Interest Rate
6.17%
Mortgage Type
Purchase Money Mortgage
Create a Home Valuation Report for This Property
The Home Valuation Report is an in-depth analysis detailing your home's value as well as a comparison with similar homes in the area
Home Values in the Area
Average Home Value in this Area
Purchase History
| Date | Buyer | Sale Price | Title Company |
|---|---|---|---|
| Nunez Francisco J | -- | Chicago Title Co | |
| David Efrain | -- | Fidelity | |
| David Efrain | $140,000 | Fidelity National Title |
Source: Public Records
Mortgage History
| Date | Status | Borrower | Loan Amount |
|---|---|---|---|
| Open | Nunez Francisco J | $203,000 | |
| Closed | David Efrain | $135,703 |
Source: Public Records
Tax History
| Year | Tax Paid | Tax Assessment Tax Assessment Total Assessment is a certain percentage of the fair market value that is determined by local assessors to be the total taxable value of land and additions on the property. | Land | Improvement |
|---|---|---|---|---|
| 2025 | $4,646 | $301,755 | $136,959 | $164,796 |
| 2024 | $4,646 | $295,839 | $134,274 | $161,565 |
| 2023 | $4,671 | $290,040 | $131,642 | $158,398 |
| 2022 | $4,470 | $284,354 | $129,061 | $155,293 |
| 2021 | $4,413 | $278,780 | $126,531 | $152,249 |
| 2019 | $3,996 | $250,500 | $113,400 | $137,100 |
| 2018 | $3,683 | $225,000 | $101,900 | $123,100 |
| 2016 | $2,558 | $141,000 | $63,900 | $77,100 |
| 2015 | $2,413 | $128,400 | $58,200 | $70,200 |
| 2014 | $2,435 | $128,400 | $58,200 | $70,200 |
Source: Public Records
Map
Nearby Homes
- 38562 35th St E
- 38539 35th St E
- 3734 Las Palmas Ave
- 38233 Pelion Ct
- 3728 E Avenue q11
- 38657 Lilacview Ave
- 38738 36th St E
- 3817 E Avenue q12
- 38122 37th St E
- 38513 32nd St E
- 38601 Dedham Ct
- 38609 32nd St E
- 0 E Palmdale Blvd Blvd Unit 25005597
- 38632 Lemsford Ave
- 4059 E Avenue q12
- 3255 E Avenue R Unit 90
- 3255 E Avenue R Unit 53
- 3255 E Avenue R Unit 91
- 3255 E Avenue R Unit 34
- 3255 E Avenue R Unit 98
- 38437 37th St E
- 38423 37th St E
- 38432 Landon Ave
- 38443 37th St E
- 38417 37th St E
- 38440 Landon Ave
- 38426 Landon Ave
- 38446 Landon Ave
- 38420 Landon Ave
- 38428 37th St E
- 38449 37th St E
- 38411 37th St E
- 38436 37th St E
- 38422 37th St E
- 38442 37th St E
- 38452 Landon Ave
- 38414 Landon Ave
- 38416 37th St E
- 38455 37th St E
- 38403 37th St E
Your Personal Tour Guide
Ask me questions while you tour the home.