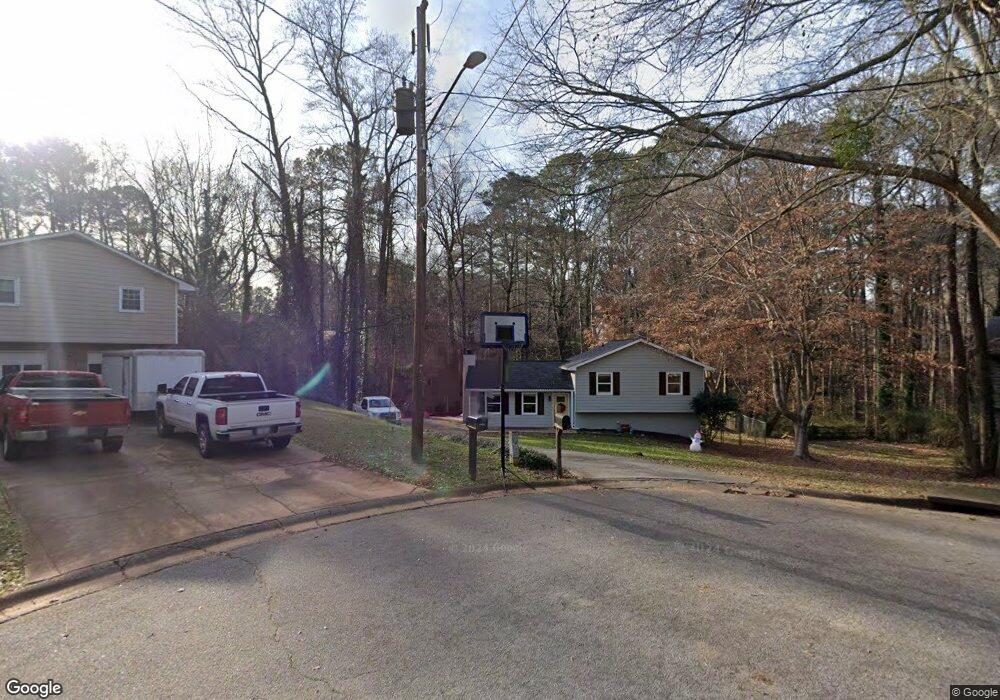
3843 Henry Ct Duluth, GA 30096
Estimated Value: $336,000 - $375,000
3
Beds
2
Baths
1,204
Sq Ft
$290/Sq Ft
Est. Value
About This Home
This home is located at 3843 Henry Ct, Duluth, GA 30096 and is currently estimated at $348,669, approximately $289 per square foot. 3843 Henry Ct is a home located in Gwinnett County with nearby schools including Chattahoochee Elementary School, Coleman Middle School, and Duluth High School.
Ownership History
Date
Name
Owned For
Owner Type
Purchase Details
Closed on
Jan 21, 2020
Sold by
Strong Elizabeth C
Bought by
Piatek Iwona and Piatek Mariusz
Current Estimated Value
Purchase Details
Closed on
Oct 28, 2004
Sold by
Johnson Thomas G and Johnson Ann
Bought by
Strong Elizabeth C
Home Financials for this Owner
Home Financials are based on the most recent Mortgage that was taken out on this home.
Original Mortgage
$122,815
Interest Rate
5.65%
Mortgage Type
VA
Purchase Details
Closed on
Oct 27, 1998
Sold by
Perrin James and Tompson Nancy H
Bought by
Johnson Thomas Galen
Home Financials for this Owner
Home Financials are based on the most recent Mortgage that was taken out on this home.
Original Mortgage
$86,400
Interest Rate
6.65%
Mortgage Type
New Conventional
Purchase Details
Closed on
Dec 2, 1993
Sold by
Redfern Melissa
Bought by
Perrin James L
Home Financials for this Owner
Home Financials are based on the most recent Mortgage that was taken out on this home.
Original Mortgage
$75,344
Interest Rate
7.14%
Mortgage Type
FHA
Create a Home Valuation Report for This Property
The Home Valuation Report is an in-depth analysis detailing your home's value as well as a comparison with similar homes in the area
Home Values in the Area
Average Home Value in this Area
Purchase History
| Date | Buyer | Sale Price | Title Company |
|---|---|---|---|
| Piatek Iwona | $165,800 | -- | |
| Strong Elizabeth C | $128,000 | -- | |
| Johnson Thomas Galen | $108,000 | -- | |
| Perrin James L | $76,500 | -- |
Source: Public Records
Mortgage History
| Date | Status | Borrower | Loan Amount |
|---|---|---|---|
| Previous Owner | Strong Elizabeth C | $122,815 | |
| Previous Owner | Johnson Thomas Galen | $86,400 | |
| Previous Owner | Perrin James L | $75,344 |
Source: Public Records
Tax History
| Year | Tax Paid | Tax Assessment Tax Assessment Total Assessment is a certain percentage of the fair market value that is determined by local assessors to be the total taxable value of land and additions on the property. | Land | Improvement |
|---|---|---|---|---|
| 2025 | $941 | $129,920 | $27,880 | $102,040 |
| 2024 | $4,227 | $132,080 | $31,200 | $100,880 |
| 2023 | $4,227 | $118,200 | $22,000 | $96,200 |
| 2022 | $3,229 | $100,600 | $22,000 | $78,600 |
| 2021 | $2,175 | $66,320 | $18,000 | $48,320 |
| 2020 | $2,432 | $73,600 | $16,000 | $57,600 |
| 2019 | $2,970 | $73,600 | $16,000 | $57,600 |
| 2018 | $1,928 | $58,240 | $12,800 | $45,440 |
| 2016 | $1,555 | $47,040 | $11,600 | $35,440 |
| 2015 | $1,795 | $44,520 | $11,600 | $32,920 |
| 2014 | -- | $44,520 | $11,600 | $32,920 |
Source: Public Records
Map
Nearby Homes
- 3081 Frankie Ln
- 3874 Pine Needle Dr
- 4025 Ivy Run Cir
- 3746 Strathmore Dr
- 3830 Gallant Fox Ct
- 3880 Gallant Fox Ct
- 2988 First St
- 4125 Boles Creek Dr
- 3607 W Lawrenceville St
- 3598 Parkridge Pointe
- 3295 Dundee Ridge Way
- 2648 Baxter Pines Way
- 4065 Craig Dr
- 2755 Pine St
- 3132 Hill St NW Unit 1
- 3207 Hill St
- 4109 Abbotts Bridge Rd
- 4207 Rogers Creek Ct
- 3310 McClure Woods Ct
- 3460 Hardy St
- 3837 Henry Ct
- 3838 Henry Ct
- 3824 Pine Needle Dr Unit 3824
- 3824 Pine Needle Dr
- 3814 Pine Needle Dr
- 3830 Henry Ct
- 3831 Henry Ct
- 3814 Pine Needle Dr NW
- 3834 Pine Needle Dr
- 3804 Pine Needle Dr
- 3844 Pine Needle Dr
- 3868 Ben Place
- 3794 Pine Needle Dr
- 3091 Frankie Ln
- 3858 Ben Place
- 3161 Crestview Cir
- 3854 Pine Needle Dr
- 3151 Crestview Cir
- 3071 Frankie Ln
- 3784 Pine Needle Dr
Your Personal Tour Guide
Ask me questions while you tour the home.