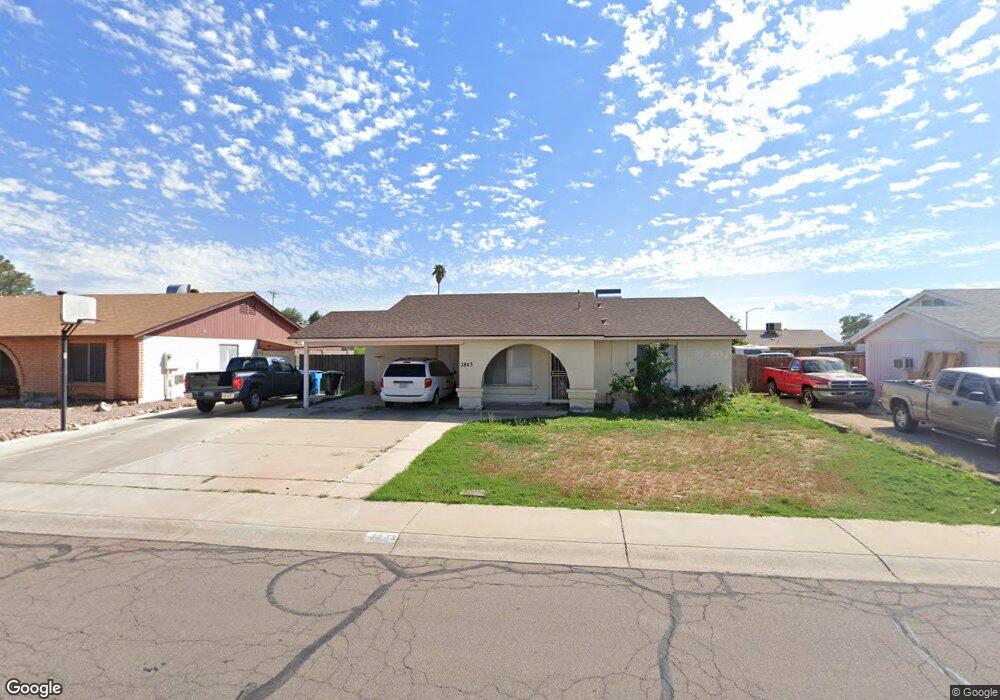
3843 W Libby St Glendale, AZ 85308
Deer Valley NeighborhoodEstimated Value: $299,596 - $375,000
--
Bed
2
Baths
1,622
Sq Ft
$207/Sq Ft
Est. Value
About This Home
This home is located at 3843 W Libby St, Glendale, AZ 85308 and is currently estimated at $336,149, approximately $207 per square foot. 3843 W Libby St is a home located in Maricopa County with nearby schools including Mirage Elementary School, Desert Sky Middle School, and Deer Valley High School.
Ownership History
Date
Name
Owned For
Owner Type
Purchase Details
Closed on
Dec 13, 2004
Sold by
Bell Rebecca M and Pennington Rebecca M
Bought by
Bell Rebecca M
Current Estimated Value
Home Financials for this Owner
Home Financials are based on the most recent Mortgage that was taken out on this home.
Original Mortgage
$109,600
Outstanding Balance
$54,778
Interest Rate
5.7%
Mortgage Type
New Conventional
Estimated Equity
$281,371
Purchase Details
Closed on
Oct 25, 2000
Sold by
Neal Christopher S
Bought by
Pennington Rebecca M
Home Financials for this Owner
Home Financials are based on the most recent Mortgage that was taken out on this home.
Original Mortgage
$90,210
Interest Rate
7.89%
Mortgage Type
New Conventional
Purchase Details
Closed on
Nov 11, 1994
Sold by
Walker Fred and Grossman Nancy
Bought by
Neal Christopher S
Home Financials for this Owner
Home Financials are based on the most recent Mortgage that was taken out on this home.
Original Mortgage
$63,088
Interest Rate
8.91%
Mortgage Type
FHA
Create a Home Valuation Report for This Property
The Home Valuation Report is an in-depth analysis detailing your home's value as well as a comparison with similar homes in the area
Home Values in the Area
Average Home Value in this Area
Purchase History
| Date | Buyer | Sale Price | Title Company |
|---|---|---|---|
| Bell Rebecca M | -- | -- | |
| Pennington Rebecca M | $93,000 | Capital Title Agency | |
| Neal Christopher S | $63,500 | Transamerica Title Ins Co |
Source: Public Records
Mortgage History
| Date | Status | Borrower | Loan Amount |
|---|---|---|---|
| Open | Bell Rebecca M | $109,600 | |
| Closed | Pennington Rebecca M | $90,210 | |
| Previous Owner | Neal Christopher S | $63,088 |
Source: Public Records
Tax History Compared to Growth
Tax History
| Year | Tax Paid | Tax Assessment Tax Assessment Total Assessment is a certain percentage of the fair market value that is determined by local assessors to be the total taxable value of land and additions on the property. | Land | Improvement |
|---|---|---|---|---|
| 2025 | $1,096 | $12,737 | -- | -- |
| 2024 | $1,078 | $12,130 | -- | -- |
| 2023 | $1,078 | $28,060 | $5,610 | $22,450 |
| 2022 | $1,038 | $21,810 | $4,360 | $17,450 |
| 2021 | $1,084 | $19,630 | $3,920 | $15,710 |
| 2020 | $1,064 | $18,230 | $3,640 | $14,590 |
| 2019 | $1,031 | $17,130 | $3,420 | $13,710 |
| 2018 | $996 | $15,780 | $3,150 | $12,630 |
| 2017 | $961 | $14,000 | $2,800 | $11,200 |
| 2016 | $907 | $13,230 | $2,640 | $10,590 |
| 2015 | $810 | $12,670 | $2,530 | $10,140 |
Source: Public Records
Map
Nearby Homes
- 4001 W Libby St
- 3935 W Muriel Dr
- 3643 W Grovers Ave
- 17402 N 39th Ave
- 4119 W Saint John Rd
- 4020 W Anderson Dr
- 3821 W Danbury Dr
- 3705 W Villa Theresa Dr
- 3602 W Campo Bello Dr
- 17848 N 34th Ln
- 4144 W Hartford Ave
- 18427 N 36th Ave
- 17633 N Lindner Dr
- 3434 W Danbury Dr Unit 103
- 3434 W Danbury Dr Unit 204
- 17809 N 34th Ave
- 3430 W Bluefield Ave
- 3420 W Danbury Dr Unit C130
- 4417 W Sandra Cir
- 3917 W Juniper Ave
- 3837 W Libby St
- 3849 W Libby St
- 3844 W Grovers Ave
- 3850 W Grovers Ave
- 3838 W Grovers Ave
- 3831 W Libby St
- 3844 W Libby St
- 3838 W Libby St
- 3850 W Libby St
- 3832 W Grovers Ave
- 3825 W Libby St
- 3826 W Grovers Ave
- 3826 W Libby St
- 17836 N 38th Dr
- 17835 N 39th Ave
- 3819 W Libby St
- 3829 W Grovers Ave
- 3835 W Grovers Ave
- 3821 W Grovers Ave
- 3820 W Libby St