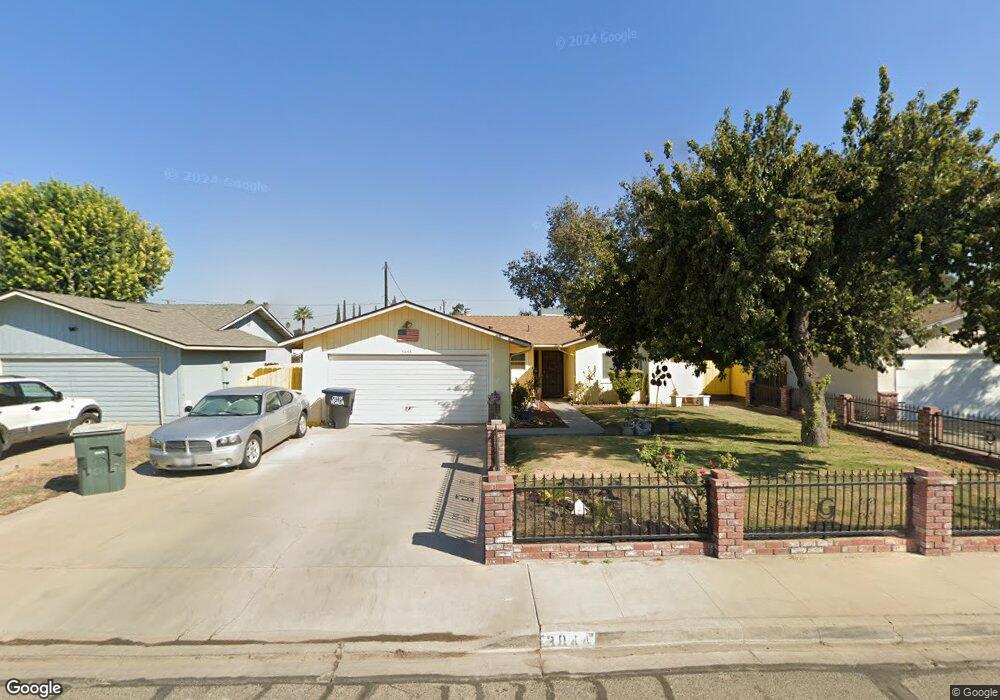
3844 W Howard Ave Visalia, CA 93277
Estimated Value: $295,000 - $358,000
3
Beds
2
Baths
1,245
Sq Ft
$256/Sq Ft
Est. Value
About This Home
This home is located at 3844 W Howard Ave, Visalia, CA 93277 and is currently estimated at $318,292, approximately $255 per square foot. 3844 W Howard Ave is a home located in Tulare County with nearby schools including Veva Blunt Elementary School, La Joya Middle School, and El Diamante High School.
Ownership History
Date
Name
Owned For
Owner Type
Purchase Details
Closed on
Oct 12, 2023
Sold by
Lara Gloria D
Bought by
Lara Family Trust and Lara
Current Estimated Value
Purchase Details
Closed on
Sep 28, 2023
Sold by
Lara Gloria D
Bought by
Lara Family Trust and Lara
Purchase Details
Closed on
May 15, 2000
Sold by
Gonzales Paul C
Bought by
Lara Ruben G and Lara Gloria D
Home Financials for this Owner
Home Financials are based on the most recent Mortgage that was taken out on this home.
Original Mortgage
$91,590
Interest Rate
8.53%
Mortgage Type
FHA
Purchase Details
Closed on
Jul 24, 1995
Sold by
Brainard Elaine O
Bought by
Gonzales Paul C and Gonzales Gloria
Home Financials for this Owner
Home Financials are based on the most recent Mortgage that was taken out on this home.
Original Mortgage
$72,100
Interest Rate
7.62%
Mortgage Type
Purchase Money Mortgage
Create a Home Valuation Report for This Property
The Home Valuation Report is an in-depth analysis detailing your home's value as well as a comparison with similar homes in the area
Home Values in the Area
Average Home Value in this Area
Purchase History
| Date | Buyer | Sale Price | Title Company |
|---|---|---|---|
| Lara Family Trust | -- | None Listed On Document | |
| Lara Family Trust | -- | None Listed On Document | |
| Lara Ruben G | $93,000 | Fidelity National Title Co | |
| Gonzales Paul C | -- | Landmark Title Company |
Source: Public Records
Mortgage History
| Date | Status | Borrower | Loan Amount |
|---|---|---|---|
| Previous Owner | Lara Ruben G | $91,590 | |
| Previous Owner | Gonzales Paul C | $72,100 |
Source: Public Records
Tax History Compared to Growth
Tax History
| Year | Tax Paid | Tax Assessment Tax Assessment Total Assessment is a certain percentage of the fair market value that is determined by local assessors to be the total taxable value of land and additions on the property. | Land | Improvement |
|---|---|---|---|---|
| 2025 | $1,433 | $142,484 | $46,112 | $96,372 |
| 2024 | $1,433 | $139,691 | $45,208 | $94,483 |
| 2023 | $1,392 | $136,953 | $44,322 | $92,631 |
| 2022 | $1,329 | $134,268 | $43,453 | $90,815 |
| 2021 | $1,329 | $131,635 | $42,601 | $89,034 |
| 2020 | $1,313 | $130,285 | $42,164 | $88,121 |
| 2019 | $1,279 | $127,730 | $41,337 | $86,393 |
| 2018 | $1,240 | $125,225 | $40,526 | $84,699 |
| 2017 | $1,231 | $122,769 | $39,731 | $83,038 |
| 2016 | $1,202 | $120,362 | $38,952 | $81,410 |
| 2015 | $1,165 | $118,554 | $38,367 | $80,187 |
| 2014 | $1,165 | $116,231 | $37,615 | $78,616 |
Source: Public Records
Map
Nearby Homes
- 3708 W Paradise Ave
- 3515 W Iris Ave
- 3507 W Howard Ave
- 1633 S Chinowth St
- 3425 W Laurel Ave
- 820 S Chinowth St Unit 93
- 820 S Chinowth St Unit 72
- 820 S Chinowth St
- 820 S Chinowth St Unit 98
- 820 S Chinowth St Unit 102
- 820 S Chinowth St Unit 80
- 820 S Chinowth St Unit 70
- 820 S Chinowth St Unit 76
- 820 S Chinowth St Unit 74
- 3548 W Fairview Ave
- 4438 W Feemster Ave
- 1937 S Royal Oaks Dr
- 849 S Cindy St
- 4527 W Iris Ave
- 3125 W Howard Ave
- 3902 W Howard Ave
- 3838 W Howard Ave
- 3910 W Howard Ave
- 3826 W Howard Ave
- 3845 W Iris Ave Unit 1
- 3845 W Iris Ave
- 3847 W Howard Ave
- 3837 W Howard Ave
- 3901 W Iris Ave
- 3835 W Iris Ave
- 3818 W Howard Ave
- 3920 W Howard Ave
- 3905 W Howard Ave
- 3827 W Howard Ave
- 3913 W Iris Ave
- 3821 W Iris Ave
- 3915 W Howard Ave
- 3810 W Howard Ave
- 3928 W Howard Ave
- 3817 W Howard Ave