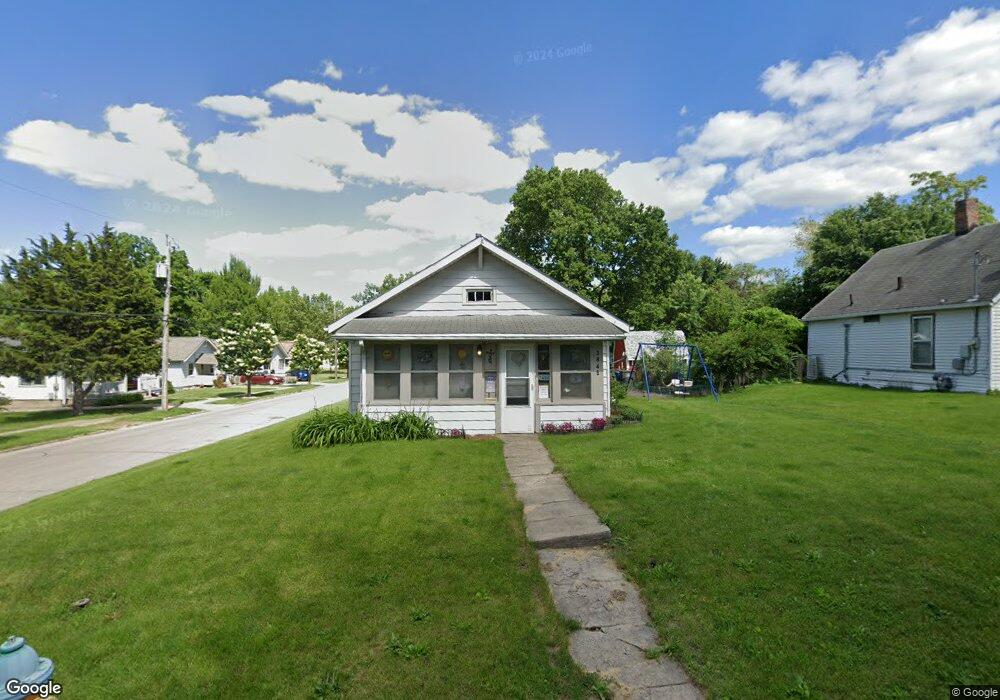
3845 1st St Des Moines, IA 50313
Highland Park NeighborhoodEstimated Value: $132,476 - $168,000
2
Beds
1
Bath
840
Sq Ft
$172/Sq Ft
Est. Value
About This Home
This home is located at 3845 1st St, Des Moines, IA 50313 and is currently estimated at $144,369, approximately $171 per square foot. 3845 1st St is a home located in Polk County with nearby schools including Madison Elementary School, Harding Middle School, and North High School.
Ownership History
Date
Name
Owned For
Owner Type
Purchase Details
Closed on
Dec 16, 2019
Sold by
Shearer Debra R and Shearer Dane
Bought by
Fales Stacey W
Current Estimated Value
Purchase Details
Closed on
Dec 24, 2014
Sold by
Fales Stacey W
Bought by
Fales Stacey W and Shearer Debra R
Create a Home Valuation Report for This Property
The Home Valuation Report is an in-depth analysis detailing your home's value as well as a comparison with similar homes in the area
Home Values in the Area
Average Home Value in this Area
Purchase History
| Date | Buyer | Sale Price | Title Company |
|---|---|---|---|
| Fales Stacey W | -- | None Available | |
| Fales Stacey W | -- | None Available |
Source: Public Records
Tax History Compared to Growth
Tax History
| Year | Tax Paid | Tax Assessment Tax Assessment Total Assessment is a certain percentage of the fair market value that is determined by local assessors to be the total taxable value of land and additions on the property. | Land | Improvement |
|---|---|---|---|---|
| 2025 | $2,192 | $128,100 | $29,200 | $98,900 |
| 2024 | $2,192 | $111,400 | $25,300 | $86,100 |
| 2023 | $2,122 | $111,400 | $25,300 | $86,100 |
| 2022 | $2,104 | $90,000 | $21,400 | $68,600 |
| 2021 | $1,992 | $90,000 | $21,400 | $68,600 |
| 2020 | $2,068 | $79,800 | $19,100 | $60,700 |
| 2019 | $1,980 | $79,800 | $19,100 | $60,700 |
| 2018 | $1,960 | $73,700 | $17,400 | $56,300 |
| 2017 | $1,802 | $73,700 | $17,400 | $56,300 |
| 2016 | $1,756 | $66,600 | $15,600 | $51,000 |
| 2015 | $1,756 | $66,600 | $15,600 | $51,000 |
| 2014 | $1,712 | $64,400 | $14,900 | $49,500 |
Source: Public Records
Map
Nearby Homes