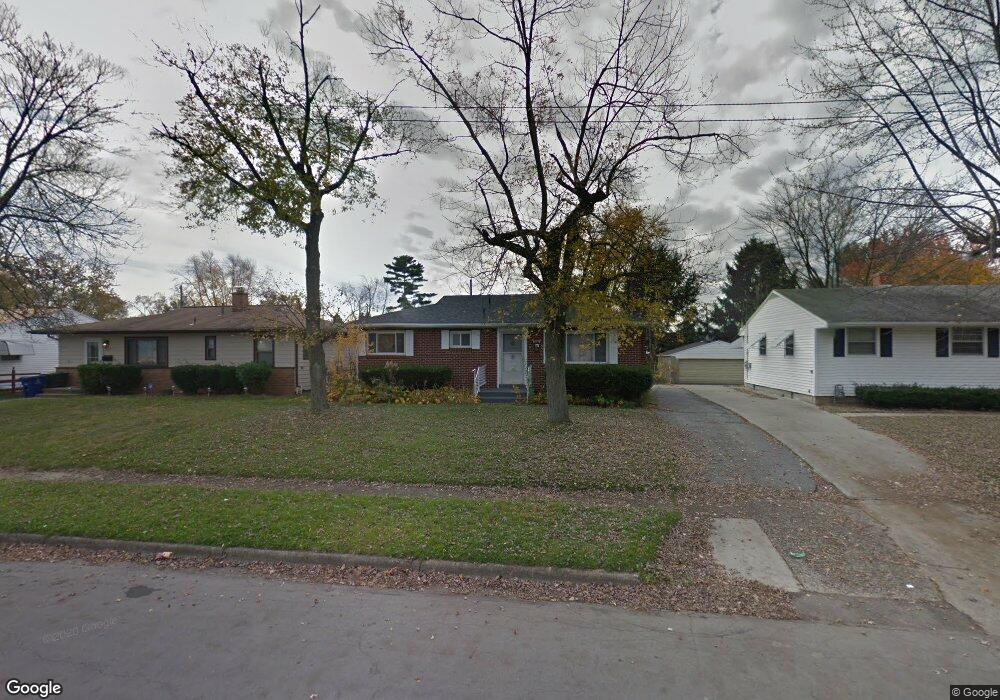
3845 Bolton Ave Columbus, OH 43227
Beechwood NeighborhoodEstimated Value: $165,000 - $218,000
2
Beds
2
Baths
999
Sq Ft
$200/Sq Ft
Est. Value
About This Home
This home is located at 3845 Bolton Ave, Columbus, OH 43227 and is currently estimated at $199,640, approximately $199 per square foot. 3845 Bolton Ave is a home located in Franklin County with nearby schools including Shady Lane Elementary School, Sherwood Middle School, and Walnut Ridge High School.
Ownership History
Date
Name
Owned For
Owner Type
Purchase Details
Closed on
Nov 7, 2023
Sold by
Abbey Gustave K
Bought by
Abbey Melita L Garrett
Current Estimated Value
Purchase Details
Closed on
Jun 16, 2008
Sold by
Heritage Home Buyers Llc
Bought by
Garrett Melita
Purchase Details
Closed on
Oct 21, 2002
Sold by
3845 Bolton Trust
Bought by
Heritage Home Buyers Llc
Purchase Details
Closed on
Jul 12, 2002
Sold by
Kleski Alla
Bought by
3845 Bolton Trust
Purchase Details
Closed on
May 24, 2001
Sold by
Estate Of Henry W Kleski
Bought by
Kleski Alla
Purchase Details
Closed on
May 31, 1968
Bought by
Kleski Henry
Create a Home Valuation Report for This Property
The Home Valuation Report is an in-depth analysis detailing your home's value as well as a comparison with similar homes in the area
Home Values in the Area
Average Home Value in this Area
Purchase History
| Date | Buyer | Sale Price | Title Company |
|---|---|---|---|
| Abbey Melita L Garrett | -- | None Listed On Document | |
| Garrett Melita | $47,000 | None Available | |
| Heritage Home Buyers Llc | -- | -- | |
| 3845 Bolton Trust | $66,000 | Ohio Title | |
| Kleski Alla | -- | -- | |
| Kleski Henry | -- | -- |
Source: Public Records
Tax History Compared to Growth
Tax History
| Year | Tax Paid | Tax Assessment Tax Assessment Total Assessment is a certain percentage of the fair market value that is determined by local assessors to be the total taxable value of land and additions on the property. | Land | Improvement |
|---|---|---|---|---|
| 2024 | $3,197 | $69,760 | $15,190 | $54,570 |
| 2023 | $3,157 | $69,755 | $15,190 | $54,565 |
| 2022 | $1,629 | $30,660 | $5,460 | $25,200 |
| 2021 | $1,632 | $30,660 | $5,460 | $25,200 |
| 2020 | $1,635 | $30,660 | $5,460 | $25,200 |
| 2019 | $1,504 | $24,190 | $4,380 | $19,810 |
| 2018 | $1,426 | $24,190 | $4,380 | $19,810 |
| 2017 | $1,504 | $24,190 | $4,380 | $19,810 |
| 2016 | $1,484 | $21,840 | $4,270 | $17,570 |
| 2015 | $1,351 | $21,840 | $4,270 | $17,570 |
| 2014 | $1,354 | $21,840 | $4,270 | $17,570 |
| 2013 | $786 | $25,690 | $5,040 | $20,650 |
Source: Public Records
Map
Nearby Homes
- 3945 Dillon Dr
- 1294 Dellwood Ave
- 1220 Elderwood Ave
- 3955 E Fulton St
- 931 E Fulton St
- 3598 Astor Ave
- 3563 Astor Ave
- 3566 Seabrook Ave
- 4144 Mcallister Ave
- 4181 Colby Ave
- 1291 Westphal Ave
- 4094 E Main St
- 1490 Elaine Rd Unit 1462
- 963 Erickson Ave
- 3811 Brentwood Ct
- 1656 Vilardo Ln
- 1640 Striebel Rd
- 3353 Towers Ct S
- 1635 Elaine Rd
- 892 Ruby Ave
- 3851 Bolton Ave
- 3839 Bolton Ave
- 3859 Bolton Ave
- 1210 Carolwood Ave
- 1206 Carolwood Ave
- 3831 Bolton Ave
- 1184 Beechwood Rd
- 3865 Bolton Ave
- 1192 Beechwood Rd
- 1212 Carolwood Ave
- 3848 Bolton Ave
- 3842 Bolton Ave
- 3856 Bolton Ave
- 3834 Bolton Ave
- 1214 Carolwood Ave
- 3864 Bolton Ave
- 3871 Bolton Ave
- 3870 Bolton Ave
- 1154 Beechwood Rd
- 3877 Bolton Ave