
Seller's Agent in 2024
Christina Axvig
Realty87
(319) 721-8351
151 Total Sales

Estimated Value: $213,000 - $269,242
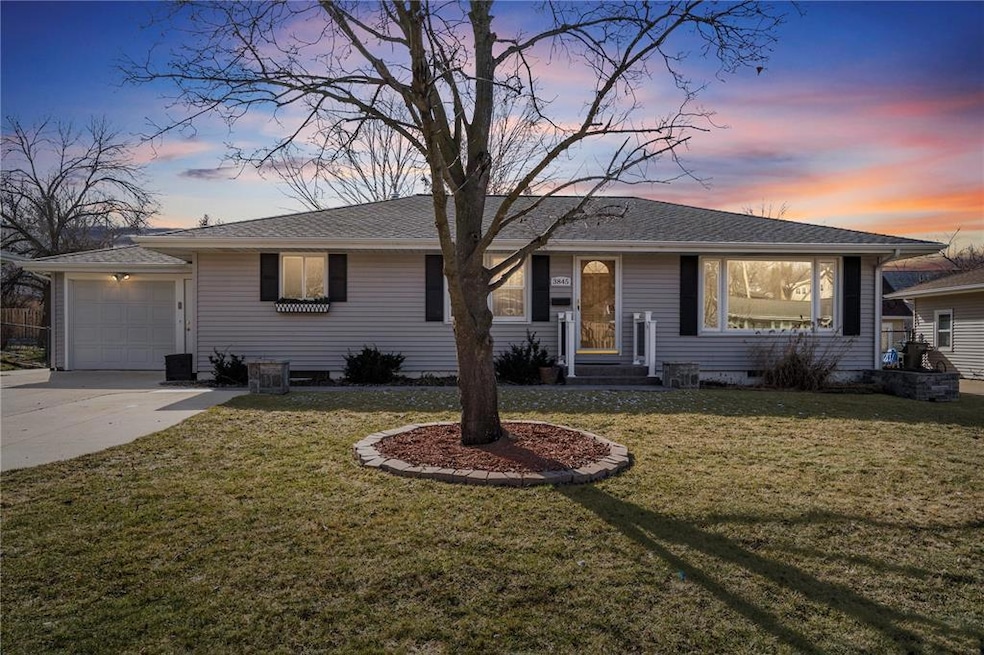
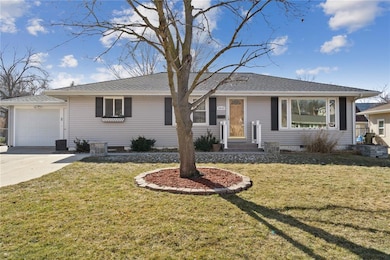
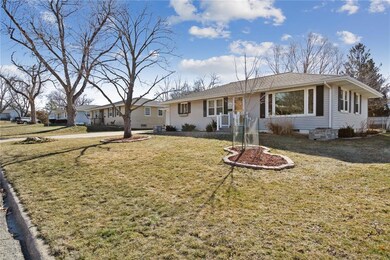
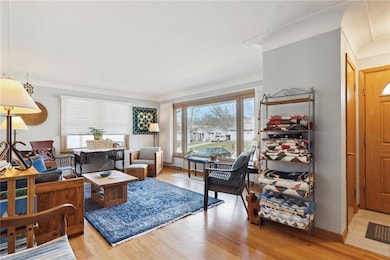
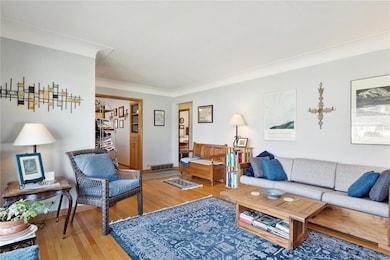
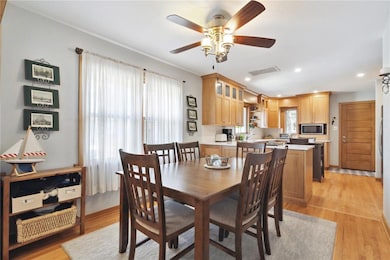
Welcome to your dream home on the SE side! Step inside to discover newly installed custom cabinetry in the kitchen in 2020, adding a touch of elegance and functionality to your culinary adventures. The warmth of hardwood flooring, flowing seamlessly from room to room, creating a sense of continuity and timeless beauty. 3rd bedroom on main level has door installed to backyard. Picture yourself basking in the sunshine or hosting unforgettable gatherings in your gorgeous backyard. A pergola provides a shaded haven (with sunshade to block late afternoon sun), perfect for alfresco dining or simply unwinding with a good book. And for those extra special moments, a charming gazebo awaits, offering a picturesque backdrop for celebrations and cherished memories. Other amenities included a 110 V designated outlet in garage to charge your car. Updated main bath. Lower level has so much extra space. Seller’s use it as their music studio and rec room. Non-conforming room and full bath. Furnace and AC installed July 2022. This SE side ranch home is more than just a house—it's a sanctuary where every detail has been carefully crafted to enhance your lifestyle. Don't miss the opportunity to make it yours!
| Date | Buyer | Sale Price | Title Company |
|---|---|---|---|
| Jones Carrie A | $265,500 | None Listed On Document | |
| Daspit Joseph P | $135,000 | None Available |
| Date | Status | Borrower | Loan Amount |
|---|---|---|---|
| Open | Jones Carrie A | $238,501 |
| Date | Event | Price | List to Sale | Price per Sq Ft | Prior Sale |
|---|---|---|---|---|---|
| 04/05/2024 04/05/24 | Sold | $265,001 | +8.2% | $120 / Sq Ft | |
| 03/07/2024 03/07/24 | Pending | -- | -- | -- | |
| 02/27/2024 02/27/24 | For Sale | $245,000 | +81.5% | $111 / Sq Ft | |
| 03/29/2012 03/29/12 | Sold | $135,000 | -3.6% | $61 / Sq Ft | View Prior Sale |
| 02/24/2012 02/24/12 | Pending | -- | -- | -- | |
| 12/08/2011 12/08/11 | For Sale | $140,000 | -- | $63 / Sq Ft |
| Year | Tax Paid | Tax Assessment Tax Assessment Total Assessment is a certain percentage of the fair market value that is determined by local assessors to be the total taxable value of land and additions on the property. | Land | Improvement |
|---|---|---|---|---|
| 2025 | $3,142 | $223,200 | $42,400 | $180,800 |
| 2024 | $3,510 | $203,900 | $42,400 | $161,500 |
| 2023 | $3,510 | $195,000 | $42,400 | $152,600 |
| 2022 | $3,042 | $175,300 | $33,200 | $142,100 |
| 2021 | $3,262 | $155,800 | $33,200 | $122,600 |
| 2020 | $3,262 | $156,400 | $29,500 | $126,900 |
| 2019 | $2,918 | $143,900 | $29,500 | $114,400 |
| 2018 | $2,834 | $143,900 | $29,500 | $114,400 |
| 2017 | $2,879 | $137,900 | $29,500 | $108,400 |
| 2016 | $2,879 | $135,500 | $29,500 | $106,000 |
| 2015 | $2,875 | $135,109 | $29,488 | $105,621 |
| 2014 | $2,690 | $131,873 | $29,488 | $102,385 |
| 2013 | $2,560 | $131,873 | $29,488 | $102,385 |
Seller's Agent in 2024
Christina Axvig
Realty87
(319) 721-8351
151 Total Sales
Buyer's Agent in 2024
Julie Gassmann
Pinnacle Realty LLC
(319) 651-6801
184 Total Sales
Seller's Agent in 2012
Jan Hullaby
KW Advantage
(319) 573-4031
46 Total Sales
Source: Cedar Rapids Area Association of REALTORS®
MLS Number: 2400805
APN: 14243-06009-00000
Disclaimer: Certain information contained herein is derived from information provided by parties other than Homes.com. All information provided is deemed reliable, but is not guaranteed to be accurate and should be independently verified.
![]() IDX information is provided exclusively for personal, non-commercial use, and may not be used for any purpose other than to identify prospective properties consumers may be interested in purchasing.
IDX information is provided exclusively for personal, non-commercial use, and may not be used for any purpose other than to identify prospective properties consumers may be interested in purchasing.
Information is deemed reliable but not guaranteed.