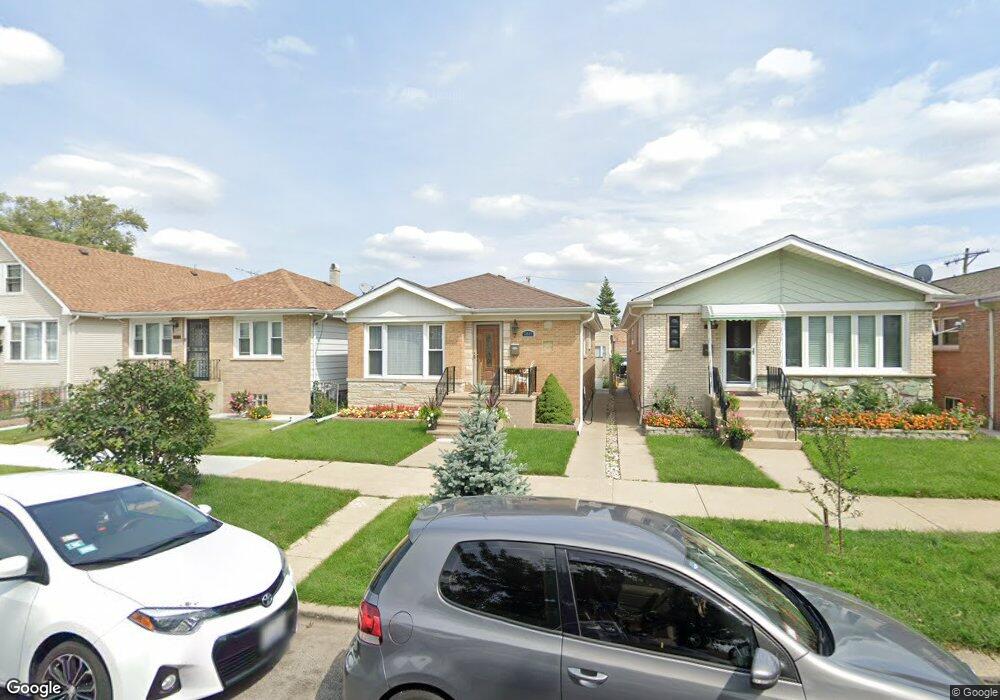
3845 N Oconto Ave Chicago, IL 60634
Belmont Heights NeighborhoodEstimated Value: $351,000 - $407,000
3
Beds
1
Bath
1,111
Sq Ft
$332/Sq Ft
Est. Value
About This Home
This home is located at 3845 N Oconto Ave, Chicago, IL 60634 and is currently estimated at $369,274, approximately $332 per square foot. 3845 N Oconto Ave is a home located in Cook County with nearby schools including Bridge Elementary School, Steinmetz College Prep, and St. Francis Borgia School.
Ownership History
Date
Name
Owned For
Owner Type
Purchase Details
Closed on
Aug 10, 2005
Sold by
Niedojadlo Ireneusz and Niedojadlo Ewa
Bought by
Fraczek Dariusz and Fraczek Krystyna
Current Estimated Value
Home Financials for this Owner
Home Financials are based on the most recent Mortgage that was taken out on this home.
Original Mortgage
$281,600
Outstanding Balance
$156,934
Interest Rate
6.62%
Mortgage Type
New Conventional
Estimated Equity
$212,340
Purchase Details
Closed on
Mar 12, 1998
Sold by
Kelk Gerald M and Kelk Gerald M
Bought by
Niedojadlo Ireneusz and Niedojadlo Ewa
Home Financials for this Owner
Home Financials are based on the most recent Mortgage that was taken out on this home.
Original Mortgage
$147,600
Interest Rate
7.09%
Purchase Details
Closed on
Aug 23, 1996
Sold by
Pawelko Melanija and Palys Irene
Bought by
Kelk Gerald M and Kelk Gerald M
Home Financials for this Owner
Home Financials are based on the most recent Mortgage that was taken out on this home.
Original Mortgage
$84,000
Interest Rate
8.27%
Create a Home Valuation Report for This Property
The Home Valuation Report is an in-depth analysis detailing your home's value as well as a comparison with similar homes in the area
Home Values in the Area
Average Home Value in this Area
Purchase History
| Date | Buyer | Sale Price | Title Company |
|---|---|---|---|
| Fraczek Dariusz | $352,000 | Marquis Title | |
| Niedojadlo Ireneusz | $164,000 | Professional National Title | |
| Kelk Gerald M | $159,000 | Attorneys Natl Title Network |
Source: Public Records
Mortgage History
| Date | Status | Borrower | Loan Amount |
|---|---|---|---|
| Open | Fraczek Dariusz | $281,600 | |
| Previous Owner | Niedojadlo Ireneusz | $147,600 | |
| Previous Owner | Kelk Gerald M | $84,000 |
Source: Public Records
Tax History Compared to Growth
Tax History
| Year | Tax Paid | Tax Assessment Tax Assessment Total Assessment is a certain percentage of the fair market value that is determined by local assessors to be the total taxable value of land and additions on the property. | Land | Improvement |
|---|---|---|---|---|
| 2024 | $3,776 | $26,543 | $9,300 | $17,243 |
| 2023 | $3,659 | $21,211 | $7,440 | $13,771 |
| 2022 | $3,659 | $21,211 | $7,440 | $13,771 |
| 2021 | $3,595 | $21,210 | $7,440 | $13,770 |
| 2020 | $3,783 | $20,083 | $4,650 | $15,433 |
| 2019 | $3,794 | $22,315 | $4,650 | $17,665 |
| 2018 | $3,729 | $22,315 | $4,650 | $17,665 |
| 2017 | $3,567 | $19,946 | $4,092 | $15,854 |
| 2016 | $3,495 | $19,946 | $4,092 | $15,854 |
| 2015 | $3,174 | $19,946 | $4,092 | $15,854 |
| 2014 | $2,924 | $18,330 | $3,720 | $14,610 |
| 2013 | $2,856 | $18,330 | $3,720 | $14,610 |
Source: Public Records
Map
Nearby Homes
- 3924 N Oconto Ave
- 3947 N Neva Ave
- 3721 N Octavia Ave
- 7151 W Irving Park Rd Unit 2
- 7431 W Forest Preserve Ave
- 3630 N Harlem Ave Unit 510
- 3630 N Harlem Ave Unit 205
- 4016 N Odell Ave
- 3638 N Odell Ave
- 3929 N Oleander Ave
- 3615 N Osceola Ave
- 7408 W Addison St
- 3952 N Oleander Ave
- 4129 N Oketo Ave
- 3529 N Nottingham Ave
- 3919 N Oriole Ave
- 3518 N Odell Ave
- 3629 N Sayre Ave
- 3909 N New England Ave
- 3507 N Osceola Ave
- 3841 N Oconto Ave
- 3847 N Oconto Ave
- 3837 N Oconto Ave
- 3849 N Oconto Ave
- 3833 N Oconto Ave
- 3851 N Oconto Ave
- 3842 N Harlem Ave
- 3831 N Oconto Ave
- 3855 N Oconto Ave
- 3846 N Harlem Ave
- 3829 N Oconto Ave
- 3848 N Harlem Ave Unit 58
- 3859 N Oconto Ave
- 3859 N Oconto Ave Unit G
- 3859 N Oconto Ave
- 3852 N Harlem Ave
- 3838 1/2 N Harlem Ave Unit B
- 3838 N Harlem Ave Unit B
- 3838 N Harlem Ave Unit 2B
- 3838 N Harlem Ave Unit 2