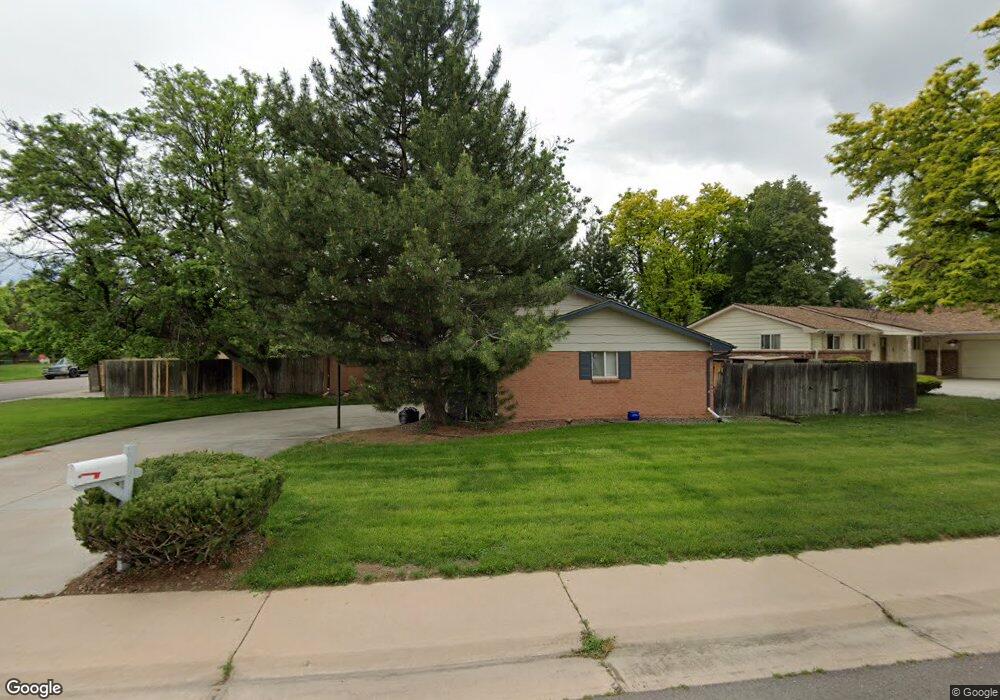
3845 S Chase St Denver, CO 80235
Fort Logan NeighborhoodEstimated Value: $709,792 - $815,000
4
Beds
3
Baths
2,382
Sq Ft
$314/Sq Ft
Est. Value
About This Home
This home is located at 3845 S Chase St, Denver, CO 80235 and is currently estimated at $748,948, approximately $314 per square foot. 3845 S Chase St is a home located in Denver County with nearby schools including Sabin World School, Bear Valley International School, and John F Kennedy High School.
Ownership History
Date
Name
Owned For
Owner Type
Purchase Details
Closed on
May 25, 2011
Sold by
Brown Ray A and Brown Shirley M
Bought by
Koshy Suman
Current Estimated Value
Home Financials for this Owner
Home Financials are based on the most recent Mortgage that was taken out on this home.
Original Mortgage
$238,781
Outstanding Balance
$165,712
Interest Rate
4.85%
Mortgage Type
FHA
Estimated Equity
$583,236
Purchase Details
Closed on
Nov 1, 2000
Sold by
Lair Douglas L and Lair Trisha M
Bought by
Brown Ray A and Brown Shirley M
Home Financials for this Owner
Home Financials are based on the most recent Mortgage that was taken out on this home.
Original Mortgage
$192,000
Interest Rate
7.86%
Purchase Details
Closed on
Aug 29, 1996
Sold by
Brown Omar L and Brown Joann M
Bought by
Lair Douglas L and Lair Trisha M
Home Financials for this Owner
Home Financials are based on the most recent Mortgage that was taken out on this home.
Original Mortgage
$135,000
Interest Rate
10.8%
Create a Home Valuation Report for This Property
The Home Valuation Report is an in-depth analysis detailing your home's value as well as a comparison with similar homes in the area
Home Values in the Area
Average Home Value in this Area
Purchase History
| Date | Buyer | Sale Price | Title Company |
|---|---|---|---|
| Koshy Suman | $278,000 | Stewart Title | |
| Brown Ray A | $267,000 | -- | |
| Lair Douglas L | $185,000 | -- |
Source: Public Records
Mortgage History
| Date | Status | Borrower | Loan Amount |
|---|---|---|---|
| Open | Koshy Suman | $238,781 | |
| Previous Owner | Brown Ray A | $192,000 | |
| Previous Owner | Lair Douglas L | $135,000 |
Source: Public Records
Tax History Compared to Growth
Tax History
| Year | Tax Paid | Tax Assessment Tax Assessment Total Assessment is a certain percentage of the fair market value that is determined by local assessors to be the total taxable value of land and additions on the property. | Land | Improvement |
|---|---|---|---|---|
| 2024 | $3,624 | $45,760 | $4,140 | $41,620 |
| 2023 | $3,546 | $45,760 | $4,140 | $41,620 |
| 2022 | $2,674 | $33,620 | $8,120 | $25,500 |
| 2021 | $2,580 | $34,580 | $8,350 | $26,230 |
| 2020 | $2,416 | $32,560 | $7,660 | $24,900 |
| 2019 | $2,348 | $32,560 | $7,660 | $24,900 |
| 2018 | $2,049 | $26,490 | $7,010 | $19,480 |
| 2017 | $2,043 | $26,490 | $7,010 | $19,480 |
| 2016 | $2,066 | $25,340 | $6,973 | $18,367 |
| 2015 | $1,980 | $25,340 | $6,973 | $18,367 |
| 2014 | $1,672 | $20,130 | $3,821 | $16,309 |
Source: Public Records
Map
Nearby Homes
- 3811 S Ames St
- 3792 S Fenton Way
- 3663 S Sheridan Blvd Unit A9
- 3663 S Sheridan Blvd Unit J12
- 3663 S Sheridan Blvd Unit 14
- 3666 S Depew St Unit 301
- 3558 S Depew St Unit 302
- 3656 S Depew St Unit 305
- 3656 S Depew St Unit 104
- 3586 S Depew St Unit 205
- 3586 S Depew St Unit 306
- 5935 W Mansfield Ave Unit 255
- 3643 S Sheridan Blvd Unit 12
- 3623 S Sheridan Blvd Unit 11
- 3623 S Sheridan Blvd Unit 17
- 3623 S Sheridan Blvd Unit 14
- 3623 S Sheridan Blvd Unit 12
- 3701 S Harlan St
- 6055 W Keene Ave
- 3550 S Harlan St Unit 335
- 5501 W Milan Place
- 3837 S Chase St
- 3807 S Chase St
- 3813 S Chase St
- 5559 W Milan Place
- 3819 S Chase St
- 3833 S Chase St
- 5609 W Milan Place
- 3803 S Chase St
- 5510 W Milan Place
- 5520 W Lehigh Ave
- 3825 S Chase St
- 3829 S Chase St
- 5540 W Lehigh Ave
- 5570 W Milan Place
- 5560 W Lehigh Ave
- 5679 W Milan Place
- 3832 S Eaton St
- 3828 S Eaton St
- 5590 W Lehigh Ave