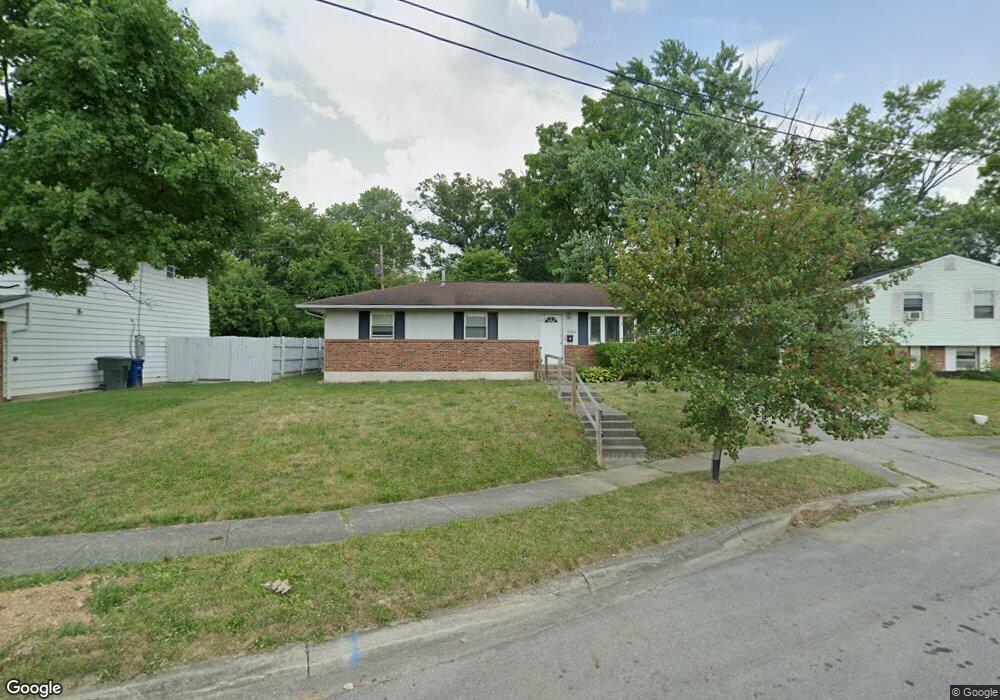
3846 Bernard Place Columbus, OH 43224
North Linden NeighborhoodEstimated Value: $207,000 - $318,000
3
Beds
2
Baths
1,336
Sq Ft
$195/Sq Ft
Est. Value
About This Home
This home is located at 3846 Bernard Place, Columbus, OH 43224 and is currently estimated at $260,212, approximately $194 per square foot. 3846 Bernard Place is a home located in Franklin County with nearby schools including North Linden Elementary School, Medina Middle School, and Mifflin High School.
Ownership History
Date
Name
Owned For
Owner Type
Purchase Details
Closed on
Jan 9, 2014
Sold by
Shelton Robert L
Bought by
Fliegel Tobi
Current Estimated Value
Purchase Details
Closed on
May 1, 2009
Sold by
Fliegel Tobi
Bought by
Fliegel Tobi and Shelton Robert L
Purchase Details
Closed on
Feb 15, 2008
Sold by
Fliegel Jared B
Bought by
Fliegel Tobi
Home Financials for this Owner
Home Financials are based on the most recent Mortgage that was taken out on this home.
Original Mortgage
$115,430
Interest Rate
5.75%
Mortgage Type
Purchase Money Mortgage
Purchase Details
Closed on
Dec 22, 2004
Sold by
Robitaille Claire A
Bought by
Fliegel Jared B
Home Financials for this Owner
Home Financials are based on the most recent Mortgage that was taken out on this home.
Original Mortgage
$91,900
Interest Rate
5.5%
Mortgage Type
Purchase Money Mortgage
Purchase Details
Closed on
Nov 6, 1989
Bought by
Robitaille Claire A
Create a Home Valuation Report for This Property
The Home Valuation Report is an in-depth analysis detailing your home's value as well as a comparison with similar homes in the area
Home Values in the Area
Average Home Value in this Area
Purchase History
| Date | Buyer | Sale Price | Title Company |
|---|---|---|---|
| Fliegel Tobi | $55,200 | None Available | |
| Fliegel Tobi | -- | None Available | |
| Fliegel Tobi | $119,000 | Premiere Ti | |
| Fliegel Jared B | $114,900 | -- | |
| Robitaille Claire A | $74,900 | -- |
Source: Public Records
Mortgage History
| Date | Status | Borrower | Loan Amount |
|---|---|---|---|
| Previous Owner | Fliegel Tobi | $115,430 | |
| Previous Owner | Fliegel Jared B | $91,900 |
Source: Public Records
Tax History Compared to Growth
Tax History
| Year | Tax Paid | Tax Assessment Tax Assessment Total Assessment is a certain percentage of the fair market value that is determined by local assessors to be the total taxable value of land and additions on the property. | Land | Improvement |
|---|---|---|---|---|
| 2024 | $3,559 | $77,670 | $18,970 | $58,700 |
| 2023 | $3,699 | $77,670 | $18,970 | $58,700 |
| 2022 | $2,347 | $44,170 | $9,450 | $34,720 |
| 2021 | $3,049 | $44,170 | $9,450 | $34,720 |
| 2020 | $2,355 | $44,170 | $9,450 | $34,720 |
| 2019 | $2,286 | $36,760 | $7,880 | $28,880 |
| 2018 | $2,277 | $36,760 | $7,880 | $28,880 |
| 2017 | $2,408 | $36,760 | $7,880 | $28,880 |
| 2016 | $2,495 | $36,720 | $6,690 | $30,030 |
| 2015 | $2,271 | $36,720 | $6,690 | $30,030 |
| 2014 | $2,277 | $36,720 | $6,690 | $30,030 |
| 2013 | $1,182 | $38,640 | $7,035 | $31,605 |
Source: Public Records
Map
Nearby Homes
- 1896 Ormond Ave
- 1936 Case Rd
- 1997 Ferris Rd
- 2023 Ferris Rd
- 2015 Melrose Ave
- 3685 Cleveland Ave
- 3750 Dresden St
- 1863 Ward Rd
- 1905 Elmore Ave
- 4111 Walford St
- 2219 Sale Rd
- 2220 Sale Rd
- 1734 Ferris Rd
- 2283 Ward Rd
- 3591 Bremen St
- 4217 Hickman Rd
- 2194 Ashley Dr
- 3583 Dresden St
- 3749 Ganson Dr
- 4057 Estates Place
- 3856 Bernard Place
- 3836 Bernard Place
- 3864 Bernard Place
- 3847 Bernard Place
- 3849 Walford St
- 3855 Walford St
- 3830 Bernard Place
- 3863 Walford St
- 3841 Walford St
- 3835 Walford St
- 3867 Bernard Place
- 3871 Walford St
- 3870 Bernard Place
- 1912 Radnor Ave
- 3827 Walford St
- 1919 Radnor Ave
- 1921 Ormond Ave
- 3877 Walford St
- 1904 Radnor Ave
- 3821 Walford St