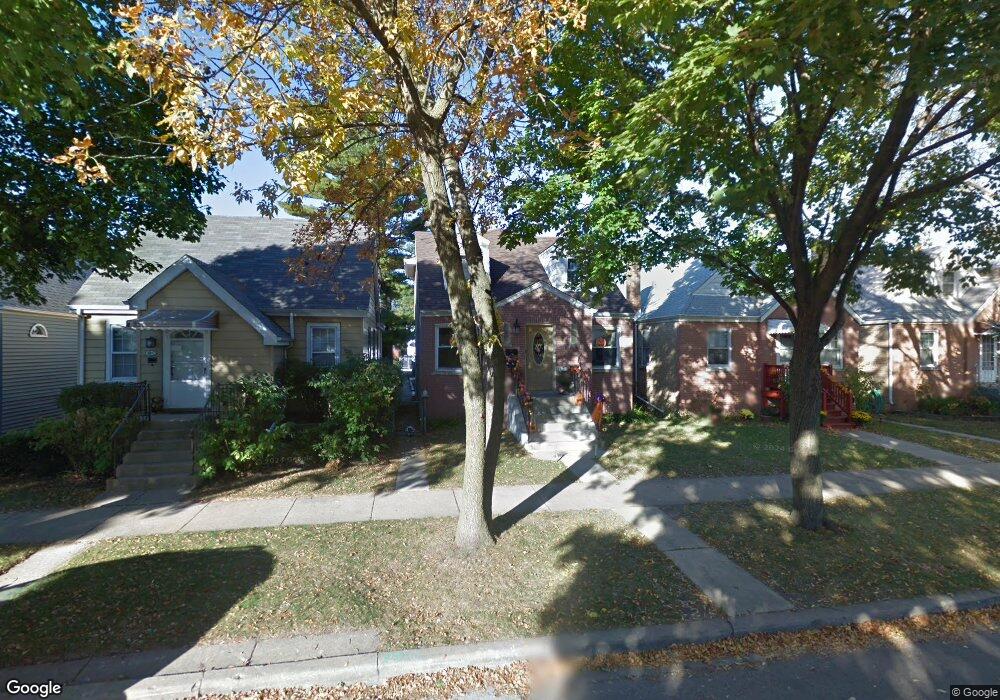
3846 N Pontiac Ave Chicago, IL 60634
Irving Woods NeighborhoodEstimated Value: $229,000 - $394,000
5
Beds
2
Baths
1,196
Sq Ft
$285/Sq Ft
Est. Value
About This Home
This home is located at 3846 N Pontiac Ave, Chicago, IL 60634 and is currently estimated at $340,756, approximately $284 per square foot. 3846 N Pontiac Ave is a home located in Cook County with nearby schools including Canty Elementary School, Steinmetz College Prep, and St. Francis Borgia School.
Ownership History
Date
Name
Owned For
Owner Type
Purchase Details
Closed on
Jul 7, 2017
Sold by
Gambino John and Gambino Carmela
Bought by
Haffey Sean P
Current Estimated Value
Home Financials for this Owner
Home Financials are based on the most recent Mortgage that was taken out on this home.
Original Mortgage
$226,500
Outstanding Balance
$188,493
Interest Rate
3.95%
Mortgage Type
New Conventional
Estimated Equity
$152,263
Purchase Details
Closed on
May 26, 1995
Sold by
Gambino John and Gambino Anthony
Bought by
Gambino John and Gambino Carmela
Home Financials for this Owner
Home Financials are based on the most recent Mortgage that was taken out on this home.
Original Mortgage
$110,500
Interest Rate
8.26%
Purchase Details
Closed on
Oct 16, 1993
Sold by
Kozubal John S and Kozubal Paul W
Bought by
Gambino John and Gambino Anthony
Create a Home Valuation Report for This Property
The Home Valuation Report is an in-depth analysis detailing your home's value as well as a comparison with similar homes in the area
Home Values in the Area
Average Home Value in this Area
Purchase History
| Date | Buyer | Sale Price | Title Company |
|---|---|---|---|
| Haffey Sean P | $270,000 | Heritage Title Company | |
| Gambino John | -- | -- | |
| Gambino John | $72,666 | -- |
Source: Public Records
Mortgage History
| Date | Status | Borrower | Loan Amount |
|---|---|---|---|
| Open | Haffey Sean P | $226,500 | |
| Previous Owner | Gambino John | $110,500 |
Source: Public Records
Tax History Compared to Growth
Tax History
| Year | Tax Paid | Tax Assessment Tax Assessment Total Assessment is a certain percentage of the fair market value that is determined by local assessors to be the total taxable value of land and additions on the property. | Land | Improvement |
|---|---|---|---|---|
| 2024 | $3,523 | $27,000 | $8,700 | $18,300 |
| 2023 | $3,413 | $20,000 | $6,960 | $13,040 |
| 2022 | $3,413 | $20,000 | $6,960 | $13,040 |
| 2021 | $3,355 | $20,003 | $6,963 | $13,040 |
| 2020 | $4,356 | $22,647 | $4,350 | $18,297 |
| 2019 | $4,369 | $25,164 | $4,350 | $20,814 |
| 2018 | $4,295 | $25,164 | $4,350 | $20,814 |
| 2017 | $3,663 | $20,381 | $3,828 | $16,553 |
| 2016 | $3,584 | $20,381 | $3,828 | $16,553 |
| 2015 | $3,460 | $21,493 | $3,828 | $17,665 |
| 2014 | $3,307 | $20,379 | $3,480 | $16,899 |
| 2013 | $3,231 | $20,379 | $3,480 | $16,899 |
Source: Public Records
Map
Nearby Homes
- 3916 N Pontiac Ave
- 3926 N Plainfield Ave
- 3842 N Paris Ave
- 3759 N Pioneer Ave
- 3841 N Page Ave
- 3725 N Pacific Ave
- 8164 W Forest Preserve Ave Unit 2N
- 8159 W Forest Preserve Ave
- 3443 N Page Ave
- 8449 W Brodman Ave
- 3419 N Panama Ave
- 8434 W Brodman Ave
- 8600 W Brodman Ave
- 3447 N Osage Ave
- 7713 W Forest Preserve Ave
- 7707 W Irving Park Rd Unit 303
- 3207 N Pontiac Ave Unit 2S
- 3250 N Page Ave
- 4456 N Forestview Ave
- 4127 N Ozark Ave
- 3848 N Pontiac Ave
- 3842 N Pontiac Ave
- 3838 N Pontiac Ave
- 3852 N Pontiac Ave
- 3836 N Pontiac Ave
- 3854 N Pontiac Ave
- 3858 N Pontiac Ave
- 3832 N Pontiac Ave
- 3847 N Cumberland Ave
- 3849 N Cumberland Ave
- 3843 N Cumberland Ave
- 3853 N Cumberland Ave
- 3841 N Cumberland Ave
- 3830 N Pontiac Ave
- 3855 N Cumberland Ave
- 3839 N Cumberland Ave
- 3859 N Cumberland Ave
- 3828 N Pontiac Ave
- 3833 N Cumberland Ave
- 3847 N Pontiac Ave