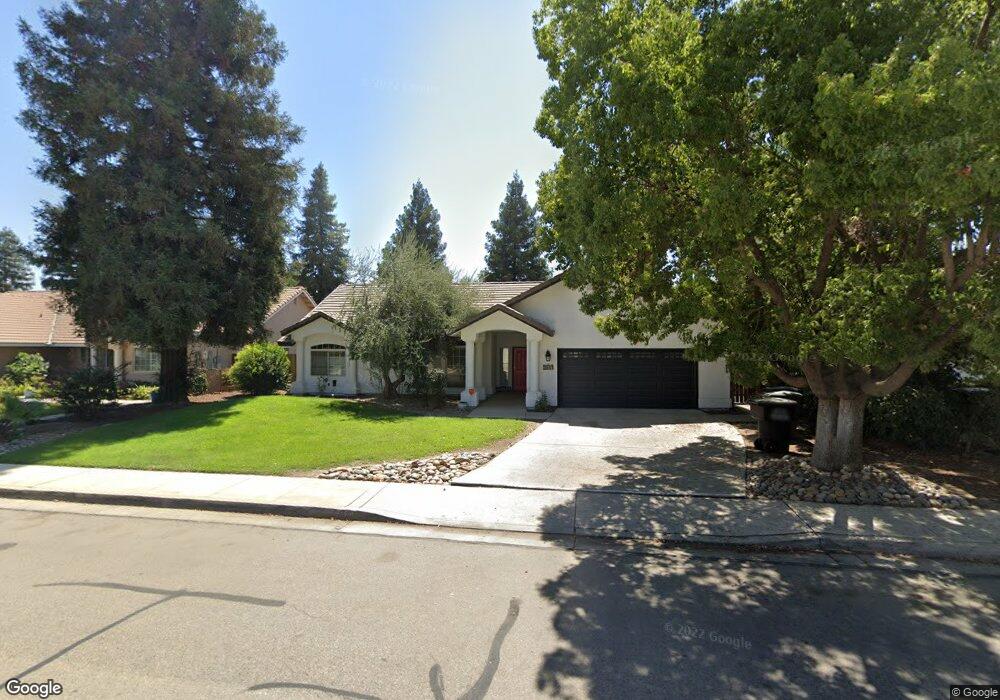
3847 E Feemster Ave Visalia, CA 93292
Southeast Visalia NeighborhoodEstimated Value: $435,850 - $534,000
3
Beds
2
Baths
1,870
Sq Ft
$252/Sq Ft
Est. Value
About This Home
This home is located at 3847 E Feemster Ave, Visalia, CA 93292 and is currently estimated at $471,463, approximately $252 per square foot. 3847 E Feemster Ave is a home located in Tulare County with nearby schools including Mineral King Elementary School, Valley Oak Middle School, and Golden West High School.
Ownership History
Date
Name
Owned For
Owner Type
Purchase Details
Closed on
Nov 25, 2022
Sold by
Dorado Sylvia Marie
Bought by
Mz Marie Living Trust
Current Estimated Value
Purchase Details
Closed on
Nov 21, 2017
Sold by
Dorado Dion M
Bought by
Dorado Sylvia Marie
Purchase Details
Closed on
Feb 10, 2011
Sold by
Wells Fargo Bank Na
Bought by
Kong Julie and Lim Steven
Home Financials for this Owner
Home Financials are based on the most recent Mortgage that was taken out on this home.
Original Mortgage
$117,750
Interest Rate
4.67%
Mortgage Type
New Conventional
Purchase Details
Closed on
Oct 25, 2010
Sold by
James Sue C
Bought by
Wells Fargo Bank Na and Wachovia Mortgage
Purchase Details
Closed on
Jun 7, 2005
Sold by
James Sue C
Bought by
James Sue C
Home Financials for this Owner
Home Financials are based on the most recent Mortgage that was taken out on this home.
Original Mortgage
$281,250
Interest Rate
6.55%
Mortgage Type
New Conventional
Purchase Details
Closed on
May 13, 2004
Sold by
Matlick Robert A
Bought by
James Sue C
Home Financials for this Owner
Home Financials are based on the most recent Mortgage that was taken out on this home.
Original Mortgage
$214,625
Interest Rate
6.09%
Mortgage Type
Purchase Money Mortgage
Purchase Details
Closed on
Jan 14, 2004
Sold by
Cendant Mobility Financial Corp
Bought by
Matlick Robert A and Matlick Diann K
Home Financials for this Owner
Home Financials are based on the most recent Mortgage that was taken out on this home.
Original Mortgage
$180,000
Interest Rate
5.79%
Mortgage Type
Purchase Money Mortgage
Purchase Details
Closed on
Jan 3, 2004
Sold by
Ziegler Terry Wayne
Bought by
Cendant Mobility Financial Corp
Home Financials for this Owner
Home Financials are based on the most recent Mortgage that was taken out on this home.
Original Mortgage
$180,000
Interest Rate
5.79%
Mortgage Type
Purchase Money Mortgage
Purchase Details
Closed on
Jan 31, 2000
Sold by
Vernon John E
Bought by
Ziegler Terry Wayne and Ziegler Claudia L
Home Financials for this Owner
Home Financials are based on the most recent Mortgage that was taken out on this home.
Original Mortgage
$153,615
Interest Rate
7.5%
Purchase Details
Closed on
Oct 14, 1994
Sold by
Packwood Real Estate Partners
Bought by
Vernon John E and Vernon Julie
Home Financials for this Owner
Home Financials are based on the most recent Mortgage that was taken out on this home.
Original Mortgage
$147,250
Interest Rate
9.23%
Create a Home Valuation Report for This Property
The Home Valuation Report is an in-depth analysis detailing your home's value as well as a comparison with similar homes in the area
Home Values in the Area
Average Home Value in this Area
Purchase History
| Date | Buyer | Sale Price | Title Company |
|---|---|---|---|
| Mz Marie Living Trust | -- | -- | |
| Dorado Sylvia Marie | -- | Chicago Title Company | |
| Dorado Sylvia Marie | $248,500 | Chicago Title Company | |
| Kong Julie | $157,000 | Chicago Title Company | |
| Wells Fargo Bank Na | $166,379 | Accommodation | |
| James Sue C | -- | Fidelity Natl Title Co Of Ca | |
| James Sue C | $252,500 | Fidelity National Title Co | |
| Matlick Robert A | $225,000 | First American Title Co | |
| Cendant Mobility Financial Corp | $225,000 | First American Title Co | |
| Ziegler Terry Wayne | $162,000 | Chicago Title Co | |
| Vernon John E | $155,000 | First American Title Ins Co |
Source: Public Records
Mortgage History
| Date | Status | Borrower | Loan Amount |
|---|---|---|---|
| Previous Owner | Kong Julie | $117,750 | |
| Previous Owner | James Sue C | $281,250 | |
| Previous Owner | James Sue C | $214,625 | |
| Previous Owner | Matlick Robert A | $180,000 | |
| Previous Owner | Ziegler Terry Wayne | $153,615 | |
| Previous Owner | Vernon John E | $147,250 |
Source: Public Records
Tax History Compared to Growth
Tax History
| Year | Tax Paid | Tax Assessment Tax Assessment Total Assessment is a certain percentage of the fair market value that is determined by local assessors to be the total taxable value of land and additions on the property. | Land | Improvement |
|---|---|---|---|---|
| 2025 | $3,022 | $282,749 | $62,580 | $220,169 |
| 2024 | $3,022 | $277,205 | $61,353 | $215,852 |
| 2023 | $2,941 | $271,770 | $60,150 | $211,620 |
| 2022 | $2,803 | $266,442 | $58,971 | $207,471 |
| 2021 | $2,805 | $261,218 | $57,815 | $203,403 |
| 2020 | $2,785 | $258,539 | $57,222 | $201,317 |
| 2019 | $2,703 | $253,470 | $56,100 | $197,370 |
| 2018 | $2,640 | $248,500 | $55,000 | $193,500 |
| 2017 | $1,933 | $173,314 | $33,117 | $140,197 |
| 2016 | $1,898 | $169,916 | $32,468 | $137,448 |
| 2015 | $1,830 | $167,363 | $31,980 | $135,383 |
| 2014 | $1,830 | $164,085 | $31,354 | $132,731 |
Source: Public Records
Map
Nearby Homes
- 3931 E Hillcrest Ave
- 4038 E Sue Ave
- 3636 E Meadow Ct
- 3934 E College Ave
- 807 S McAuliff St
- 3541 E Laura Ct
- 3623 E Seeger Ave
- 804 S Simon St
- 3917 E Myrtle Ave
- 3935 E Myrtle Ave
- 2242 S Manzanita Ct
- 2916 E Tulare Ave
- 3136 E Harter Ave
- 2207 S Crumal St
- 3540 E Cherry Ave
- 2227 S Crumal St
- 4122 E Kaweah Ave
- 2443 S Grayson St
- 4132 E Kaweah Ave
- 3728 E Kaweah Ave
- 3837 E Feemster Ave
- 3907 E Feemster Ave
- 3850 E Paradise Ave
- 3838 E Paradise Ave
- 3908 E Paradise Ave
- 3825 E Feemster Ave
- 3925 E Feemster Ave
- 3848 E Feemster Ave
- 3906 E Feemster Ave
- 3826 E Paradise Ave
- 3926 E Paradise Ave
- 3836 E Feemster Ave
- 3924 E Feemster Ave
- 3811 SE Feemster
- 3935 E Feemster Ave
- 3811 E Feemster Ave Unit 1
- 3811 E Feemster Ave
- 3824 E Feemster Ave
- 3814 E Paradise Ave
- 3938 E Paradise Ave