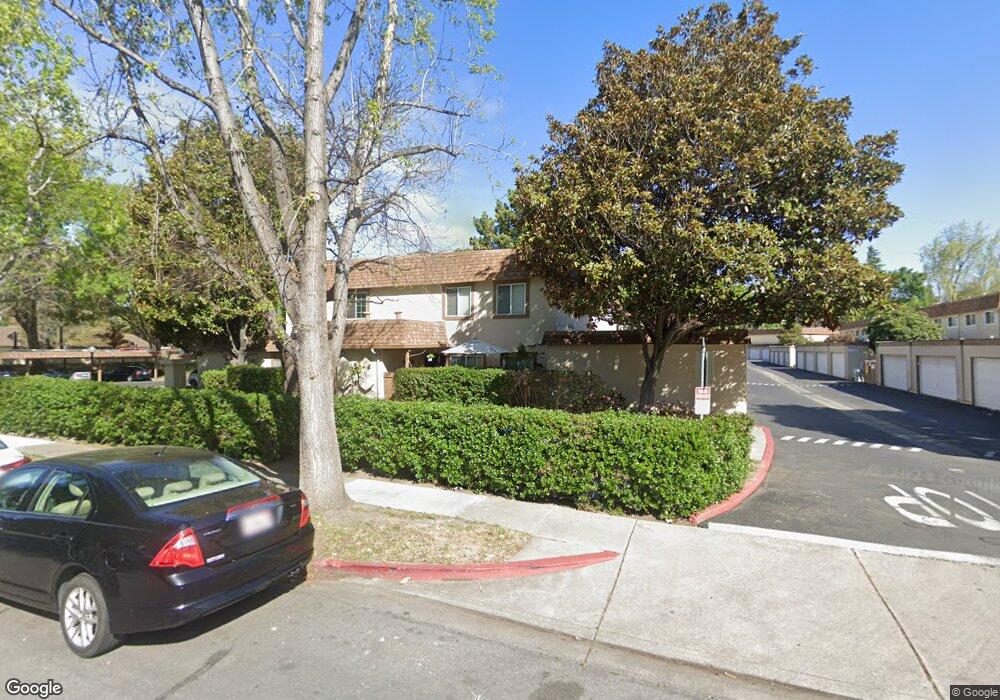
38475 Berkeley Common Fremont, CA 94536
Cherry-Guardino NeighborhoodEstimated Value: $562,082 - $715,000
2
Beds
1
Bath
888
Sq Ft
$704/Sq Ft
Est. Value
About This Home
This home is located at 38475 Berkeley Common, Fremont, CA 94536 and is currently estimated at $625,521, approximately $704 per square foot. 38475 Berkeley Common is a home located in Alameda County with nearby schools including Parkmont Elementary School, Centerville Junior High School, and Washington High School.
Ownership History
Date
Name
Owned For
Owner Type
Purchase Details
Closed on
Aug 25, 2017
Sold by
Fung Cheryl and Lee Chun
Bought by
Fung Cheryl and Lee Chun
Current Estimated Value
Home Financials for this Owner
Home Financials are based on the most recent Mortgage that was taken out on this home.
Original Mortgage
$348,750
Outstanding Balance
$291,699
Interest Rate
3.96%
Mortgage Type
New Conventional
Estimated Equity
$333,822
Purchase Details
Closed on
Apr 26, 2007
Sold by
Hei Chun and Fung Cheryl W
Bought by
Lee Chun Hei and Fung Cheryl W
Home Financials for this Owner
Home Financials are based on the most recent Mortgage that was taken out on this home.
Original Mortgage
$320,000
Interest Rate
6.15%
Mortgage Type
New Conventional
Purchase Details
Closed on
May 16, 2005
Sold by
Pang Chean and Pang Kathy
Bought by
Lee Chun Hei and Fung Cheryl W
Home Financials for this Owner
Home Financials are based on the most recent Mortgage that was taken out on this home.
Original Mortgage
$296,000
Interest Rate
4.37%
Mortgage Type
Purchase Money Mortgage
Create a Home Valuation Report for This Property
The Home Valuation Report is an in-depth analysis detailing your home's value as well as a comparison with similar homes in the area
Home Values in the Area
Average Home Value in this Area
Purchase History
| Date | Buyer | Sale Price | Title Company |
|---|---|---|---|
| Fung Cheryl | -- | Old Republic Title Company | |
| Lee Chun Hei | -- | Fidelity National Title Co | |
| Lee Chun Hei | $372,500 | Fidelity National Title Co |
Source: Public Records
Mortgage History
| Date | Status | Borrower | Loan Amount |
|---|---|---|---|
| Open | Fung Cheryl | $348,750 | |
| Closed | Lee Chun Hei | $320,000 | |
| Closed | Lee Chun Hei | $296,000 | |
| Closed | Lee Chun Hei | $37,000 |
Source: Public Records
Tax History
| Year | Tax Paid | Tax Assessment Tax Assessment Total Assessment is a certain percentage of the fair market value that is determined by local assessors to be the total taxable value of land and additions on the property. | Land | Improvement |
|---|---|---|---|---|
| 2025 | $6,569 | $524,060 | $157,218 | $366,842 |
| 2024 | $6,569 | $513,788 | $154,136 | $359,652 |
| 2023 | $6,388 | $503,715 | $151,114 | $352,601 |
| 2022 | $6,298 | $493,841 | $148,152 | $345,689 |
| 2021 | $6,153 | $484,160 | $145,248 | $338,912 |
| 2020 | $6,131 | $479,196 | $143,759 | $335,437 |
| 2019 | $6,063 | $469,804 | $140,941 | $328,863 |
| 2018 | $5,945 | $460,595 | $138,178 | $322,417 |
| 2017 | $5,798 | $451,567 | $135,470 | $316,097 |
| 2016 | $5,695 | $442,717 | $132,815 | $309,902 |
| 2015 | $4,896 | $375,000 | $112,500 | $262,500 |
| 2014 | $4,430 | $335,000 | $100,500 | $234,500 |
Source: Public Records
Map
Nearby Homes
- 38508 Mary Terrace Unit 4
- 38780 Tyson Ln Unit 205C
- 38751 Litchfield Cir
- 38533 Vancouver Common
- 38860 Garibaldi Common
- 38694 Huntington Cir
- 38623 Cherry Ln Unit 221
- 1007 Vardin Terrace
- 38614 Royal Ann Common
- 39034 Guardino Dr Unit 206
- 38908 Cherry Glen Common
- 935 Cherry Glen Cir Unit 219
- 39059 Guardino Dr Unit 206
- 39078 Guardino Dr Unit 107
- 39149 Guardino Dr Unit 247
- 39152 Guardino Dr Unit 203
- 39206 Guardino Dr Unit 310
- 39199 Guardino Dr Unit 179
- 2755 Country Dr Unit 136
- 39224 Guardino Dr Unit 204
- 38477 Berkeley Common
- 38473 Berkeley Common
- 38479 Berkeley Common
- 38471 Berkeley Common
- 38493 Berkeley Common
- 38495 Berkeley Common
- 38455 Berkeley Common
- 38491 Berkeley Common
- 38457 Berkeley Common
- 38497 Berkeley Common
- 38453 Berkeley Common
- 38499 Berkeley Common
- 38459 Berkeley Common
- 38451 Berkeley Common
- 38482 Berkeley Common
- 38478 Berkeley Common
- 38486 Berkeley Common
- 38474 Berkeley Common
- 38490 Berkeley Common
- 38470 Berkeley Common
Your Personal Tour Guide
Ask me questions while you tour the home.