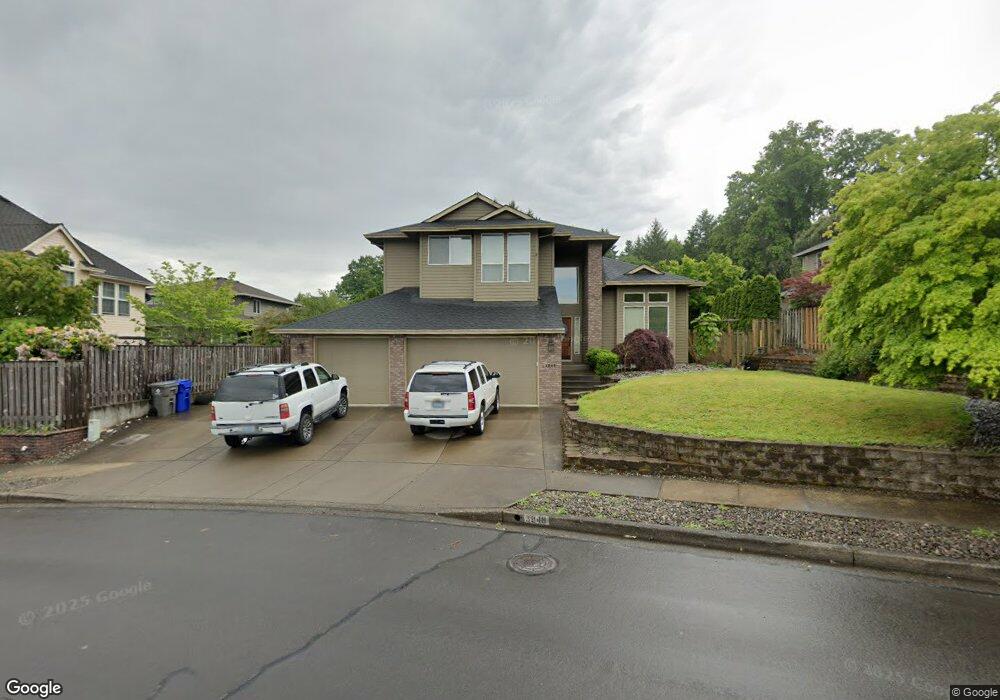
3848 SE 27th St Gresham, OR 97080
Kelly Creek NeighborhoodEstimated Value: $574,000 - $668,000
4
Beds
7
Baths
2,557
Sq Ft
$242/Sq Ft
Est. Value
About This Home
This home is located at 3848 SE 27th St, Gresham, OR 97080 and is currently estimated at $618,980, approximately $242 per square foot. 3848 SE 27th St is a home located in Multnomah County with nearby schools including Kelly Creek Elementary School, Gordon Russell Middle School, and Sam Barlow High School.
Ownership History
Date
Name
Owned For
Owner Type
Purchase Details
Closed on
Sep 26, 2018
Sold by
Reeder Robert T and Reeder Brenda K
Bought by
Atiyeh Matthew
Current Estimated Value
Purchase Details
Closed on
Nov 28, 2000
Sold by
Gaulke Mark R
Bought by
Reeder Robert T and Reeder Brenda K
Home Financials for this Owner
Home Financials are based on the most recent Mortgage that was taken out on this home.
Original Mortgage
$185,000
Interest Rate
7.86%
Mortgage Type
Purchase Money Mortgage
Purchase Details
Closed on
Oct 27, 1998
Sold by
Chet Debois Homes Inc
Bought by
Gaulke Mark R and Gaulke Claire N
Home Financials for this Owner
Home Financials are based on the most recent Mortgage that was taken out on this home.
Original Mortgage
$220,800
Interest Rate
6.6%
Mortgage Type
Purchase Money Mortgage
Create a Home Valuation Report for This Property
The Home Valuation Report is an in-depth analysis detailing your home's value as well as a comparison with similar homes in the area
Home Values in the Area
Average Home Value in this Area
Purchase History
| Date | Buyer | Sale Price | Title Company |
|---|---|---|---|
| Atiyeh Matthew | $443,000 | Chicago Title Co | |
| Reeder Robert T | $250,000 | Oregon Title Insurance Co | |
| Gaulke Mark R | $276,000 | Oregon Title Insurance Co | |
| Chet Debois Homes Inc | $45,000 | Oregon Title Insurance Co |
Source: Public Records
Mortgage History
| Date | Status | Borrower | Loan Amount |
|---|---|---|---|
| Previous Owner | Reeder Robert T | $185,000 | |
| Previous Owner | Gaulke Mark R | $220,800 | |
| Closed | Gaulke Mark R | $65,100 |
Source: Public Records
Tax History
| Year | Tax Paid | Tax Assessment Tax Assessment Total Assessment is a certain percentage of the fair market value that is determined by local assessors to be the total taxable value of land and additions on the property. | Land | Improvement |
|---|---|---|---|---|
| 2025 | $8,015 | $393,860 | -- | -- |
| 2024 | $7,672 | $382,390 | -- | -- |
| 2023 | $6,990 | $371,260 | $0 | $0 |
| 2022 | $6,795 | $360,450 | $0 | $0 |
| 2021 | $6,624 | $349,960 | $0 | $0 |
| 2020 | $6,232 | $339,770 | $0 | $0 |
| 2019 | $6,069 | $329,880 | $0 | $0 |
| 2018 | $5,787 | $320,280 | $0 | $0 |
| 2017 | $5,552 | $310,960 | $0 | $0 |
| 2016 | $4,895 | $301,910 | $0 | $0 |
Source: Public Records
Map
Nearby Homes
- 3788 SE 25th St
- 2245 SE Wendy Dr
- 3780 SE 21st Dr
- 2600 SE Orient Dr
- 2037 SE Centurion Way
- 2624 SE Hale Way
- 2728 SE Acacia Place
- 3122 SE 23rd St
- 2813 SE Baker Ave
- 2073 SE Kane Ave
- 4671 SE 21st Terrace
- 3169 SE 34th St
- 2910 SE Hillyard Rd
- 4647 SE 20th Terrace
- 3259 SE 36th St
- 3689 SE 14th St
- 2846 SE 18th Cir
- 1536 SE Condor Ave
- 1230 SE Barnes Rd
- 2314 SE Keller Ave
- 2723 SE Barnes Rd
- 2799 SE Hacienda Loop
- 2791 SE Hacienda Loop
- 2751 SE Barnes Rd
- 3837 SE Hillyard Rd
- 2829 SE Barnes Rd
- 3847 SE 27th St
- 3897 SE 27th St
- 3837 SE 27th St
- 3815 SE Hillyard Rd
- 3879 SE Hillyard Rd
- 2784 SE Hacienda Loop
- 3827 SE 27th St
- 2796 SE Hacienda Loop
- 2623 SE Barnes Rd
- 2710 SE Barnes Rd
- 2762 SE Barnes Rd
- 2783 SE Hacienda Loop
- 2559 SE Barnes Rd
- 3807 SE 27th St
Your Personal Tour Guide
Ask me questions while you tour the home.