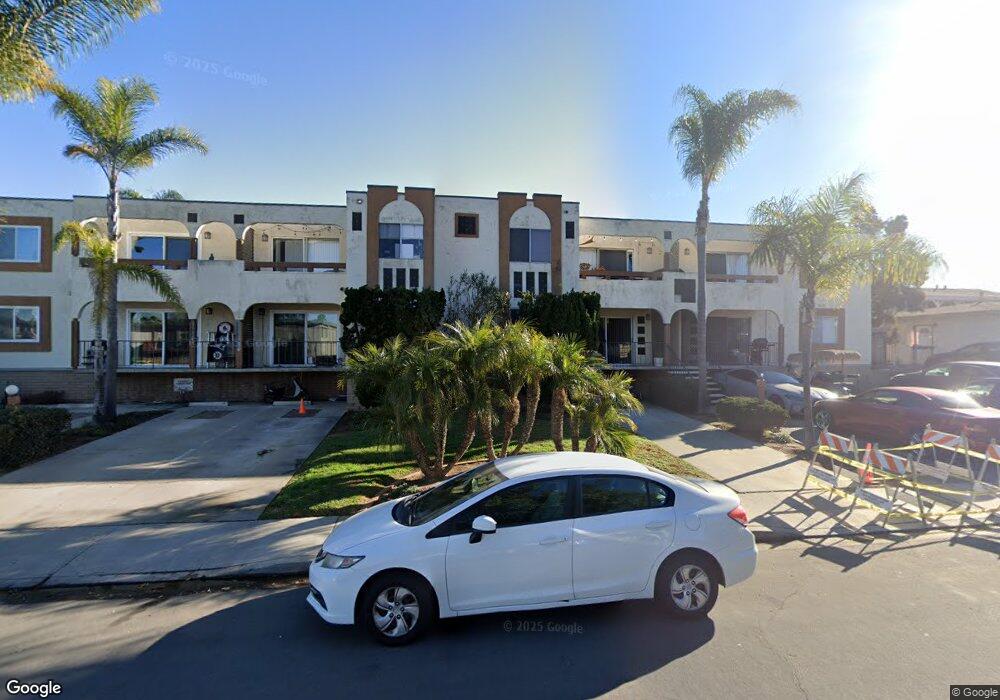
3849 Shasta St Unit 7 San Diego, CA 92109
Pacific Beach NeighborhoodEstimated Value: $641,760 - $802,000
2
Beds
1
Bath
814
Sq Ft
$886/Sq Ft
Est. Value
About This Home
This home is located at 3849 Shasta St Unit 7, San Diego, CA 92109 and is currently estimated at $720,940, approximately $885 per square foot. 3849 Shasta St Unit 7 is a home located in San Diego County with nearby schools including Crown Point Junior Music Academy, Pacific Beach Middle, and Mission Bay High School.
Ownership History
Date
Name
Owned For
Owner Type
Purchase Details
Closed on
Apr 27, 2016
Sold by
Cawavan James M
Bought by
James Michael Canavan Revocable Living T
Current Estimated Value
Purchase Details
Closed on
Nov 1, 2000
Sold by
Jaco Burns Ruth Marie and Jaco Ruth Marie
Bought by
Canavan James M
Home Financials for this Owner
Home Financials are based on the most recent Mortgage that was taken out on this home.
Original Mortgage
$110,000
Outstanding Balance
$40,475
Interest Rate
7.86%
Estimated Equity
$680,465
Purchase Details
Closed on
Oct 24, 2000
Sold by
Witt Martin D
Bought by
Jaco Ruth Marie
Home Financials for this Owner
Home Financials are based on the most recent Mortgage that was taken out on this home.
Original Mortgage
$110,000
Outstanding Balance
$40,475
Interest Rate
7.86%
Estimated Equity
$680,465
Purchase Details
Closed on
Apr 30, 1990
Purchase Details
Closed on
Mar 9, 1990
Create a Home Valuation Report for This Property
The Home Valuation Report is an in-depth analysis detailing your home's value as well as a comparison with similar homes in the area
Home Values in the Area
Average Home Value in this Area
Purchase History
| Date | Buyer | Sale Price | Title Company |
|---|---|---|---|
| James Michael Canavan Revocable Living T | -- | None Available | |
| Canavan James M | $195,000 | American Title Co | |
| Burns Ruth Marie Jaco | -- | American Title Co | |
| Jaco Ruth Marie | -- | American Title Company | |
| -- | $130,000 | -- | |
| -- | $120,000 | -- |
Source: Public Records
Mortgage History
| Date | Status | Borrower | Loan Amount |
|---|---|---|---|
| Open | Canavan James M | $110,000 |
Source: Public Records
Tax History Compared to Growth
Tax History
| Year | Tax Paid | Tax Assessment Tax Assessment Total Assessment is a certain percentage of the fair market value that is determined by local assessors to be the total taxable value of land and additions on the property. | Land | Improvement |
|---|---|---|---|---|
| 2025 | $3,483 | $293,810 | $195,878 | $97,932 |
| 2024 | $3,483 | $288,050 | $192,038 | $96,012 |
| 2023 | $3,405 | $282,403 | $188,273 | $94,130 |
| 2022 | $3,313 | $276,867 | $184,582 | $92,285 |
| 2021 | $3,289 | $271,439 | $180,963 | $90,476 |
| 2020 | $3,248 | $268,657 | $179,108 | $89,549 |
| 2019 | $3,189 | $263,391 | $175,597 | $87,794 |
| 2018 | $2,981 | $258,227 | $172,154 | $86,073 |
| 2017 | $80 | $253,165 | $168,779 | $84,386 |
| 2016 | $2,860 | $248,202 | $165,470 | $82,732 |
| 2015 | $2,817 | $244,475 | $162,985 | $81,490 |
| 2014 | $2,772 | $239,687 | $159,793 | $79,894 |
Source: Public Records
Map
Nearby Homes
- 1703 La Playa Ave Unit B
- 3955 Shasta St
- 3968 Sequoia St
- 3943 Ingraham St
- 4036 Shasta St Unit 14
- 3955 Honeycutt St Unit 201
- 4053-55 Jewell St
- 3736 Promontory St
- 3712 Promontory St
- 4073 Kendall St Unit 2
- 3705 Haines St
- 3843 Riviera Dr Unit 1
- 4064 Honeycutt St
- 3828 Riviera Dr Unit 2B
- 3850 Riviera Dr Unit 3B
- 4037 Haines St
- 3701 Riviera Dr Unit 4
- 4015 Crown Point Dr Unit 308
- 3920 Riviera Dr Unit A
- 3986 Riviera Dr
- 3849 Shasta St Unit 8
- 3849 Shasta St Unit 4
- 3849 Shasta St Unit 3
- 3849 Shasta St Unit 2
- 3849 Shasta St Unit 9
- 3849 Shasta St Unit 13
- 3849 Shasta St Unit 14
- 3849 Shasta St Unit 15
- 3849 Shasta St Unit 16
- 3849 Shasta St Unit 12
- 3849 Shasta St Unit 11
- 3849 Shasta St Unit 10
- 3849 Shasta St Unit 5
- 3825 Shasta St Unit 27
- 3851 Shasta St
- 3850 Kendall St
- 3819 Shasta St
- 3838 Kendall St
- 3863 Shasta St
- 3826 Kendall St Unit 2