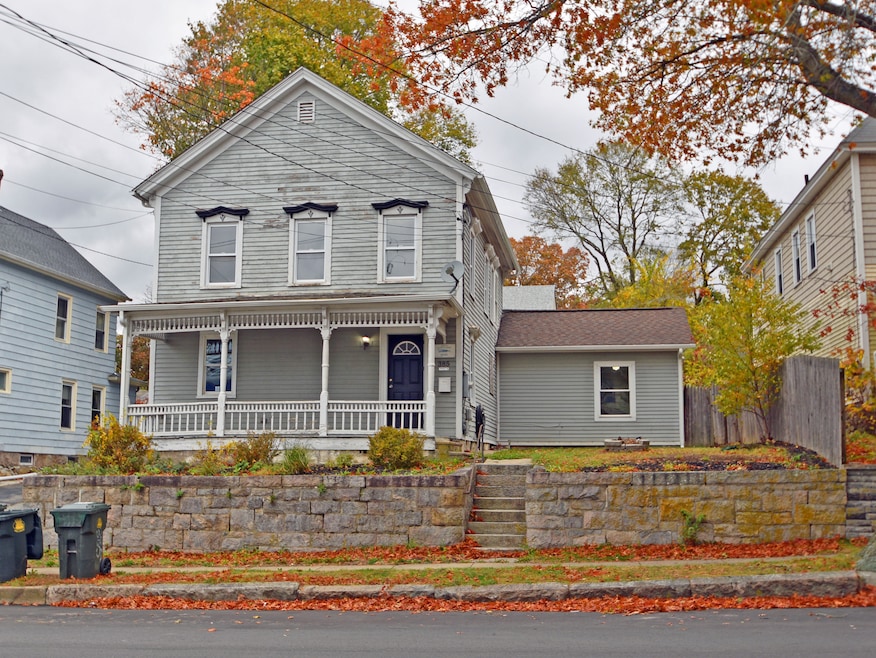
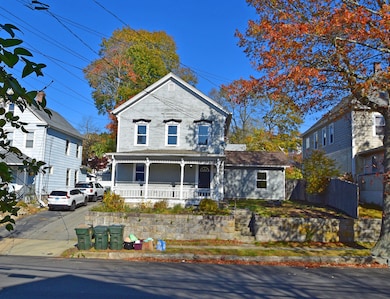
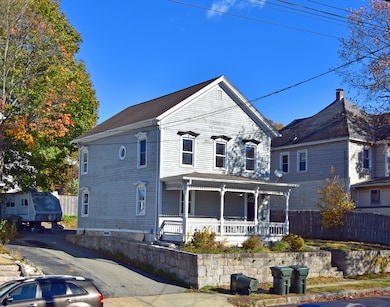
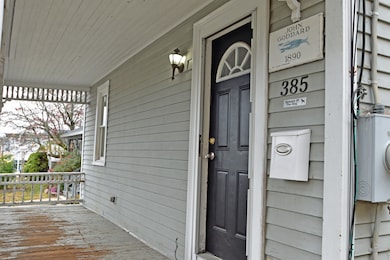

385 Broad St New London, CT 06320
Parker NeighborhoodEstimated payment $1,938/month
Highlights
- Colonial Architecture
- Attic
- Porch
- Property is near public transit
- Thermal Windows
- 5-minute walk to Mahan Park
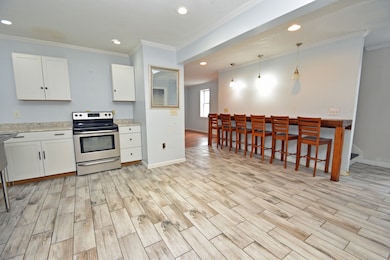
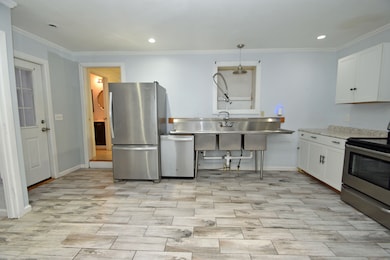
About This Home
An incredible opportunity awaits to own a piece of Connecticut history with this spacious 5-bedroom home, originally built in the 1800s. The property underwent a substantial rebuild in 2009, bringing the major systems up to date while preserving its historic charm. 2,150 square feet 5 bedroom 2 full bathroom complete in 2009 upgraded from studs out plus addition of 2nd full bathroom and bedroom on first floor added 2009. New insulation, sheetrock, framing, plumbing, mechanicals, electrical, wiring, roof and windows were done 2009. 4 bedrooms, full bath and laundry upstairs. Natural gas offered however heating system needs to be completed. Electric hot water system in working order. Finishing touches will make this large home a wonderful place that is conveniently and easy access to route 85 and I 95. Close to sub base, electric boat and more. As Is Sale.
Listing Agent
Coldwell Banker Realty Brokerage Phone: (860) 716-5347 License #RES.0766370 Listed on: 11/07/2025

Home Details
Home Type
- Single Family
Est. Annual Taxes
- $4,249
Year Built
- Built in 1884
Lot Details
- 5,663 Sq Ft Lot
- Property is zoned C-1
Home Design
- Colonial Architecture
- Concrete Foundation
- Frame Construction
- Asphalt Shingled Roof
- Wood Siding
Interior Spaces
- 1,760 Sq Ft Home
- Thermal Windows
- Unfinished Basement
- Basement Fills Entire Space Under The House
- Attic or Crawl Hatchway Insulated
- Laundry on upper level
Kitchen
- Oven or Range
- Dishwasher
Bedrooms and Bathrooms
- 5 Bedrooms
- 2 Full Bathrooms
Parking
- 4 Parking Spaces
- Private Driveway
Outdoor Features
- Porch
Location
- Property is near public transit
- Property is near shops
Schools
- New London High School
Utilities
- Hot Water Heating System
- Heating System Uses Natural Gas
- Hot Water Circulator
- Electric Water Heater
Listing and Financial Details
- Exclusions: Refrigerator, Washer, Dryer
- Assessor Parcel Number 2001831
Map
Home Values in the Area
Average Home Value in this Area
Tax History
| Year | Tax Paid | Tax Assessment Tax Assessment Total Assessment is a certain percentage of the fair market value that is determined by local assessors to be the total taxable value of land and additions on the property. | Land | Improvement |
|---|---|---|---|---|
| 2025 | $4,249 | $156,200 | $48,300 | $107,900 |
| 2024 | $4,296 | $156,200 | $48,300 | $107,900 |
| 2023 | $3,897 | $104,650 | $41,090 | $63,560 |
| 2022 | $3,904 | $104,650 | $41,090 | $63,560 |
| 2021 | $3,971 | $104,650 | $41,090 | $63,560 |
| 2020 | $3,997 | $104,650 | $41,090 | $63,560 |
| 2019 | $4,176 | $104,650 | $41,090 | $63,560 |
| 2018 | $4,008 | $91,630 | $29,890 | $61,740 |
| 2017 | $4,056 | $91,630 | $29,890 | $61,740 |
| 2016 | $3,707 | $91,630 | $29,890 | $61,740 |
| 2015 | $3,618 | $91,630 | $29,890 | $61,740 |
| 2014 | $3,140 | $91,630 | $29,890 | $61,740 |
Property History
| Date | Event | Price | List to Sale | Price per Sq Ft |
|---|---|---|---|---|
| 11/07/2025 11/07/25 | For Sale | $299,900 | -- | $170 / Sq Ft |
Purchase History
| Date | Type | Sale Price | Title Company |
|---|---|---|---|
| Quit Claim Deed | -- | None Available | |
| Quit Claim Deed | -- | None Available | |
| Quit Claim Deed | -- | None Available | |
| Quit Claim Deed | -- | None Available | |
| Quit Claim Deed | -- | None Available | |
| Quit Claim Deed | -- | None Available | |
| Quit Claim Deed | -- | None Available | |
| Quit Claim Deed | -- | None Available | |
| Quit Claim Deed | -- | None Available | |
| Warranty Deed | $135,000 | -- | |
| Warranty Deed | $135,000 | -- |
Mortgage History
| Date | Status | Loan Amount | Loan Type |
|---|---|---|---|
| Previous Owner | $125,000 | No Value Available | |
| Previous Owner | $18,000 | No Value Available | |
| Previous Owner | $15,000 | No Value Available |
Source: SmartMLS
MLS Number: 24138691
APN: NLON-000040-000257-000021
Disclaimer: Certain information contained herein is derived from information provided by parties other than Homes.com. All information provided is deemed reliable, but is not guaranteed to be accurate and should be independently verified.
![]() IDX information is provided exclusively for personal, non-commercial use, and may not be used for any purpose other than to identify prospective properties consumers may be interested in purchasing. Information is deemed reliable but not guaranteed.
IDX information is provided exclusively for personal, non-commercial use, and may not be used for any purpose other than to identify prospective properties consumers may be interested in purchasing. Information is deemed reliable but not guaranteed.
- 140 Norwood Ave
- 139 Vauxhall St
- 171 Norwood Ave
- 70 Morgan St
- 30 Margaret St
- 430 Vauxhall St
- 19 Hawthorne Dr Unit 104
- 226 Colman St
- 18 W Pleasant St
- 41 5th Ave
- 17 Amity St
- 47 Phillips St
- 14 N Phillips St
- 271 Crystal Ave
- 265 Crystal Ave
- 59 Connecticut Ave
- 55 Connecticut Ave
- 38 Mountain Ave
- 1 E Lake Dr
- 77 Colman St
- 60 Ashcraft Rd Unit 60 ashcraft road
- 19 Hawthorne Dr Unit 102
- 32 Channing St Unit 1
- 120 Broad St Unit 407
- 43 Granite St
- 120 Broad St
- 8-127 Michael Rd
- 84 Hawthorne Dr N
- 34 Williams St
- 11 Anthony Rd
- 34 Bulkeley Place
- 68 Connecticut Ave
- 94 Blackhall St
- 309 Crystal Ave
- 20 Garvin St Unit 1A
- 5 Two Mile Hill Rd
- 17 Franklin St Unit 3
- 253 State St Unit 1R
- 253 State St Unit 3R
- 253 State St Unit 2L