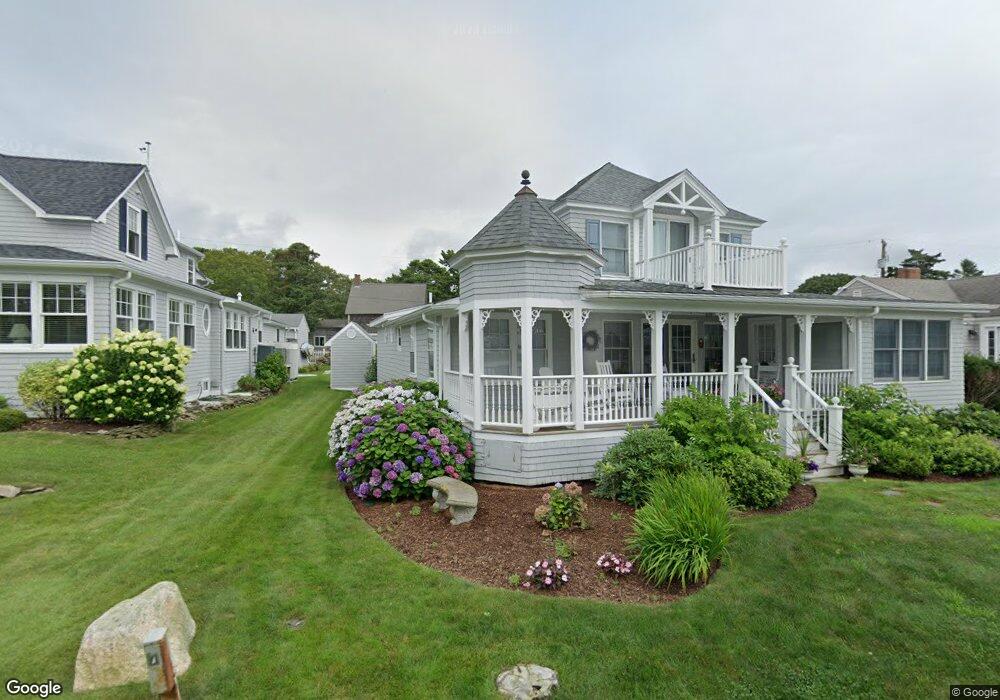
385 Circuit Ave Pocasset, MA 02559
Pocasset NeighborhoodEstimated Value: $998,000 - $1,239,000
3
Beds
2
Baths
1,892
Sq Ft
$578/Sq Ft
Est. Value
About This Home
This home is located at 385 Circuit Ave, Pocasset, MA 02559 and is currently estimated at $1,093,835, approximately $578 per square foot. 385 Circuit Ave is a home located in Barnstable County with nearby schools including Bourne High School and Cadence Academy Preschool - Bourne.
Ownership History
Date
Name
Owned For
Owner Type
Purchase Details
Closed on
Apr 29, 2025
Sold by
Becker Meryl L
Bought by
Akl Personal Residence T and Becker
Current Estimated Value
Purchase Details
Closed on
May 9, 2019
Sold by
Anne M Stonefeild Qprt M and Anne Stonefield
Bought by
Becker Meryl L
Purchase Details
Closed on
Jan 17, 2007
Sold by
Stonefield Anne M
Bought by
Stonefield Anne M
Purchase Details
Closed on
Jun 5, 2000
Sold by
Ads Rt and Stonefield Anne M
Bought by
Stonefield Anne M
Create a Home Valuation Report for This Property
The Home Valuation Report is an in-depth analysis detailing your home's value as well as a comparison with similar homes in the area
Home Values in the Area
Average Home Value in this Area
Purchase History
| Date | Buyer | Sale Price | Title Company |
|---|---|---|---|
| Akl Personal Residence T | -- | None Available | |
| Akl Personal Residence T | -- | None Available | |
| Becker Meryl L | -- | -- | |
| Becker Meryl L | -- | -- | |
| Stonefield Anne M | -- | -- | |
| Stonefield Anne M | -- | -- | |
| Stonefield Anne M | $8,925 | -- | |
| Stonefield Anne M | $8,925 | -- |
Source: Public Records
Tax History Compared to Growth
Tax History
| Year | Tax Paid | Tax Assessment Tax Assessment Total Assessment is a certain percentage of the fair market value that is determined by local assessors to be the total taxable value of land and additions on the property. | Land | Improvement |
|---|---|---|---|---|
| 2025 | $8,309 | $1,063,900 | $685,500 | $378,400 |
| 2024 | $8,125 | $1,013,100 | $652,800 | $360,300 |
| 2023 | $8,540 | $969,400 | $650,000 | $319,400 |
| 2022 | $8,885 | $880,600 | $626,300 | $254,300 |
| 2021 | $8,639 | $802,100 | $570,000 | $232,100 |
| 2020 | $8,558 | $796,800 | $564,600 | $232,200 |
| 2019 | $8,241 | $784,100 | $564,600 | $219,500 |
| 2018 | $7,874 | $747,100 | $537,800 | $209,300 |
| 2017 | $7,621 | $739,900 | $532,700 | $207,200 |
| 2016 | $7,421 | $730,400 | $532,700 | $197,700 |
| 2015 | $7,355 | $730,400 | $532,700 | $197,700 |
Source: Public Records
Map
Nearby Homes
- 89 Harbor Dr
- 171 Bellavista Dr
- 34 Kenwood Rd
- 45 Kenwood Rd
- 70 Wings Neck Rd
- 24 Richmond Rd
- 22 Nairn Rd
- 48 Red Brook Harbor Rd
- 14 Navajo Rd
- 3 Red Brook Pond Dr
- 254 Barlows Landing Rd
- 75 Winsor Rd
- 1094 County Rd
- 940 County Rd
- 461 Wings Neck Rd
- 709 County Rd
- 10 Squeteague Harbor Rd
- 940 County Rd
- 250 Scraggy Neck Rd