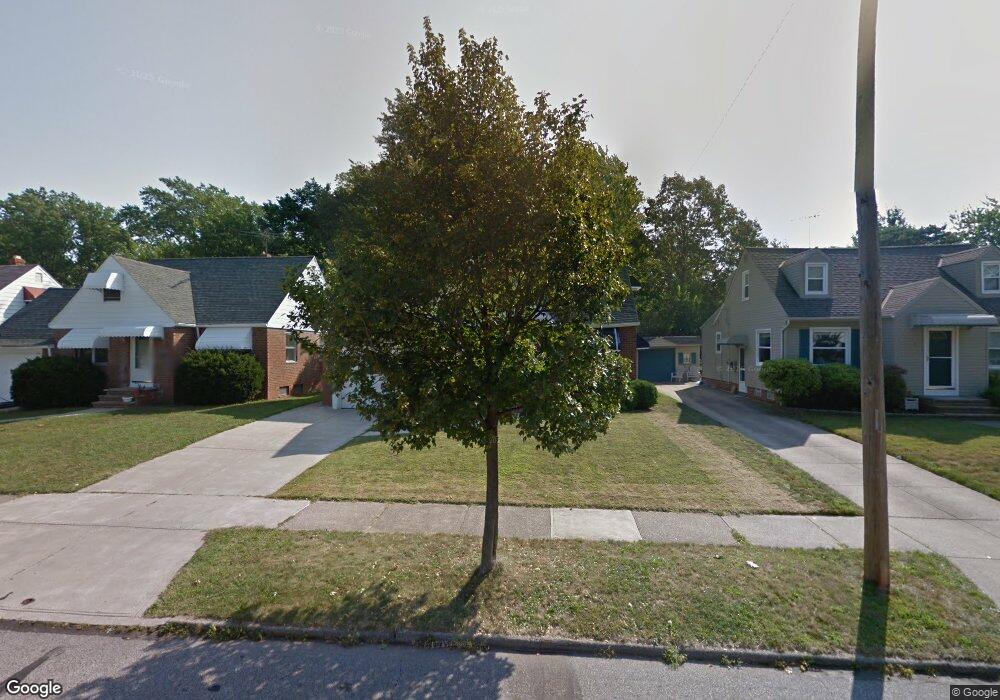
385 E 264th St Euclid, OH 44132
Estimated Value: $113,000 - $139,000
3
Beds
1
Bath
844
Sq Ft
$151/Sq Ft
Est. Value
About This Home
This home is located at 385 E 264th St, Euclid, OH 44132 and is currently estimated at $127,305, approximately $150 per square foot. 385 E 264th St is a home located in Cuyahoga County with nearby schools including Shoreview Elementary School, Euclid High School, and Ss Robert & William Catholic School.
Ownership History
Date
Name
Owned For
Owner Type
Purchase Details
Closed on
Nov 13, 2025
Sold by
Stanton Timothy J and Stanton Maria
Bought by
Stanton Fam Tr and Stanton
Current Estimated Value
Purchase Details
Closed on
Dec 12, 1996
Sold by
Whiting Robert R
Bought by
Stanton Timothy J and Stanton Maria
Home Financials for this Owner
Home Financials are based on the most recent Mortgage that was taken out on this home.
Original Mortgage
$77,775
Interest Rate
7.85%
Mortgage Type
VA
Purchase Details
Closed on
Jun 12, 1990
Sold by
Kitchel Marilyn and Kitchel George C
Bought by
Kitchel Marilyn
Purchase Details
Closed on
Dec 17, 1984
Sold by
Percic Frank
Bought by
Kitchel Marilyn and Kitchel George C
Purchase Details
Closed on
Apr 13, 1976
Sold by
Royce Jacob and Royce Petronila
Bought by
Percic Frank
Purchase Details
Closed on
Jul 1, 1975
Sold by
Royce Jacob and Royce Petronila
Bought by
Royce Jacob and Royce Petronila
Purchase Details
Closed on
Jan 1, 1975
Bought by
Royce Jacob and Royce Petronila
Create a Home Valuation Report for This Property
The Home Valuation Report is an in-depth analysis detailing your home's value as well as a comparison with similar homes in the area
Home Values in the Area
Average Home Value in this Area
Purchase History
| Date | Buyer | Sale Price | Title Company |
|---|---|---|---|
| Stanton Fam Tr | -- | Csc Document Recording (Record | |
| Stanton Timothy J | $76,250 | -- | |
| Kitchel Marilyn | -- | -- | |
| Kitchel Marilyn | $56,000 | -- | |
| Percic Frank | $39,000 | -- | |
| Royce Jacob | -- | -- | |
| Royce Jacob | -- | -- |
Source: Public Records
Mortgage History
| Date | Status | Borrower | Loan Amount |
|---|---|---|---|
| Previous Owner | Stanton Timothy J | $77,775 |
Source: Public Records
Tax History
| Year | Tax Paid | Tax Assessment Tax Assessment Total Assessment is a certain percentage of the fair market value that is determined by local assessors to be the total taxable value of land and additions on the property. | Land | Improvement |
|---|---|---|---|---|
| 2025 | $3,069 | $45,150 | $7,805 | $37,345 |
| 2024 | $3,167 | $45,150 | $7,805 | $37,345 |
| 2023 | $2,806 | $31,790 | $5,920 | $25,870 |
| 2022 | $2,744 | $31,780 | $5,920 | $25,870 |
| 2021 | $3,059 | $31,780 | $5,920 | $25,870 |
| 2020 | $2,903 | $27,410 | $5,110 | $22,300 |
| 2019 | $2,615 | $78,300 | $14,600 | $63,700 |
| 2018 | $2,406 | $27,410 | $5,110 | $22,300 |
| 2017 | $2,356 | $20,270 | $4,240 | $16,030 |
| 2016 | $2,361 | $20,270 | $4,240 | $16,030 |
| 2015 | $2,155 | $20,270 | $4,240 | $16,030 |
| 2014 | $2,155 | $20,270 | $4,240 | $16,030 |
Source: Public Records
Map
Nearby Homes
- 325 E 264th St
- 411 E 270th St
- 325 E 257th St
- 355 E 257th St
- 440 E 271st St
- 25591 Forestview Ave
- 298 E 270th St
- 26171 Shoreview Ave
- 26831 Shoreview Ave
- 610 E 266th St
- 26530 Shoreview Ave
- 26931 Shoreview Ave
- 25801 Lakeshore Blvd Unit 42
- 257 E 270th St
- 25801 Lake Shore Blvd Unit 29
- 25801 Lake Shore Blvd Unit 112
- 406 E 274th St
- 571 E 260th St
- 25731 Zeman Ave
- 579 E 260th St
Your Personal Tour Guide
Ask me questions while you tour the home.