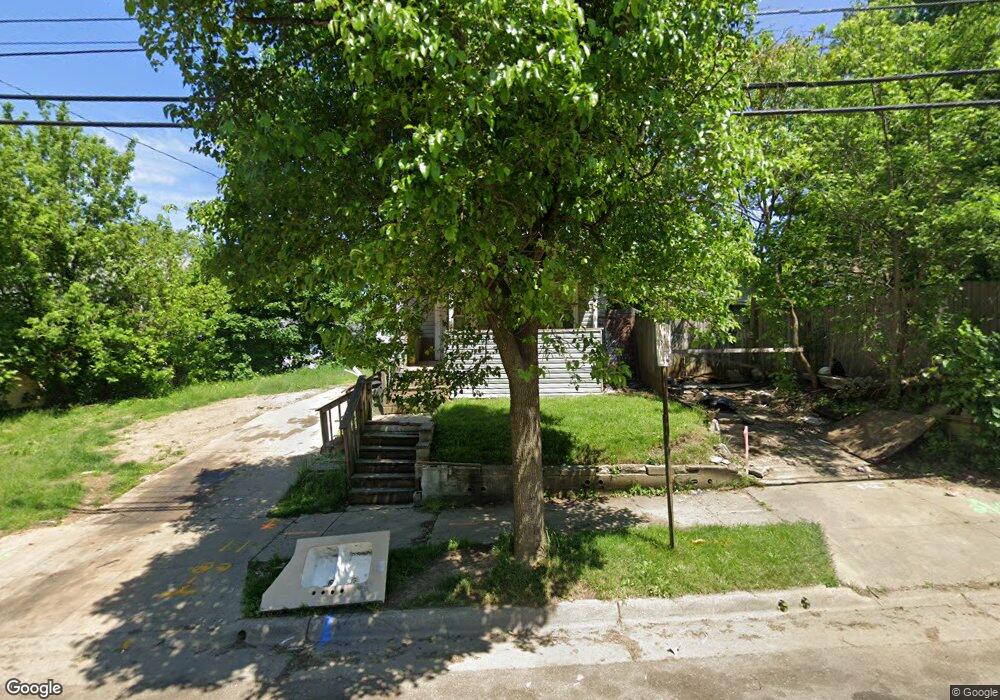
385 E Crosier St Akron, OH 44311
South Akron NeighborhoodEstimated Value: $51,758 - $82,000
1
Bed
1
Bath
756
Sq Ft
$80/Sq Ft
Est. Value
About This Home
This home is located at 385 E Crosier St, Akron, OH 44311 and is currently estimated at $60,190, approximately $79 per square foot. 385 E Crosier St is a home located in Summit County with nearby schools including North High School, Main Preparatory Academy, and St. Bernard-St. Mary Elementary School.
Ownership History
Date
Name
Owned For
Owner Type
Purchase Details
Closed on
Nov 27, 2017
Sold by
Dietrich Michael and Dietrich Cynthia
Bought by
Hines David
Current Estimated Value
Purchase Details
Closed on
Nov 4, 2004
Sold by
Hines David
Bought by
Dietrich Michael
Purchase Details
Closed on
Mar 19, 2003
Sold by
Equicredit Corporation Of Ohio
Bought by
Hines David
Purchase Details
Closed on
Aug 24, 2001
Sold by
Brown Michael
Bought by
Equicredit Corp Of Ohio
Purchase Details
Closed on
Nov 16, 1999
Sold by
Myers Kathleen
Bought by
Brown Michael
Home Financials for this Owner
Home Financials are based on the most recent Mortgage that was taken out on this home.
Original Mortgage
$44,800
Interest Rate
7.88%
Purchase Details
Closed on
Aug 14, 1998
Sold by
Mitchell David L
Bought by
Myers Kathleen
Create a Home Valuation Report for This Property
The Home Valuation Report is an in-depth analysis detailing your home's value as well as a comparison with similar homes in the area
Home Values in the Area
Average Home Value in this Area
Purchase History
| Date | Buyer | Sale Price | Title Company |
|---|---|---|---|
| Hines David | $30,670 | Patriot Title Agency Inc | |
| Dietrich Michael | $21,000 | Midland Commerce Group | |
| Hines David | $8,500 | Multiple | |
| Equicredit Corp Of Ohio | $12,000 | -- | |
| Brown Michael | $44,800 | Trident Title Agency | |
| Myers Kathleen | $6,000 | -- |
Source: Public Records
Mortgage History
| Date | Status | Borrower | Loan Amount |
|---|---|---|---|
| Previous Owner | Brown Michael | $44,800 |
Source: Public Records
Tax History
| Year | Tax Paid | Tax Assessment Tax Assessment Total Assessment is a certain percentage of the fair market value that is determined by local assessors to be the total taxable value of land and additions on the property. | Land | Improvement |
|---|---|---|---|---|
| 2025 | $31,971 | $10,403 | $2,615 | $7,788 |
| 2024 | $594 | $10,403 | $2,615 | $7,788 |
| 2023 | $31,971 | $10,403 | $2,615 | $7,788 |
| 2022 | $461 | $6,122 | $1,540 | $4,582 |
| 2021 | $713 | $6,122 | $1,540 | $4,582 |
| 2020 | $455 | $6,120 | $1,540 | $4,580 |
| 2019 | $2,921 | $10,730 | $2,870 | $7,860 |
| 2018 | $809 | $10,730 | $2,870 | $7,860 |
| 2017 | $902 | $10,730 | $2,870 | $7,860 |
| 2016 | $1,357 | $10,910 | $2,870 | $8,040 |
| 2015 | $902 | $10,910 | $2,870 | $8,040 |
| 2014 | $895 | $10,910 | $2,870 | $8,040 |
| 2013 | $1,195 | $11,360 | $2,870 | $8,490 |
Source: Public Records
Map
Nearby Homes
- 796 Allyn St
- 805 Sumner St
- 888 Beardsley St
- 796 Sherman St
- 891 Grant St
- 778 Brown St Unit 780
- 756 Brown St
- 750 Brown St
- 301 E Voris St
- 885 Brown St
- 678 Sumner St Unit 682
- 673 Sumner St
- 543 Corice St
- 555 Corice St
- 1012 Kling St
- 566 Mckinley Ave
- 653 Sumner St
- 429 Lovisa St
- 281 E Thornton St
- 261 E Thornton St
Your Personal Tour Guide
Ask me questions while you tour the home.