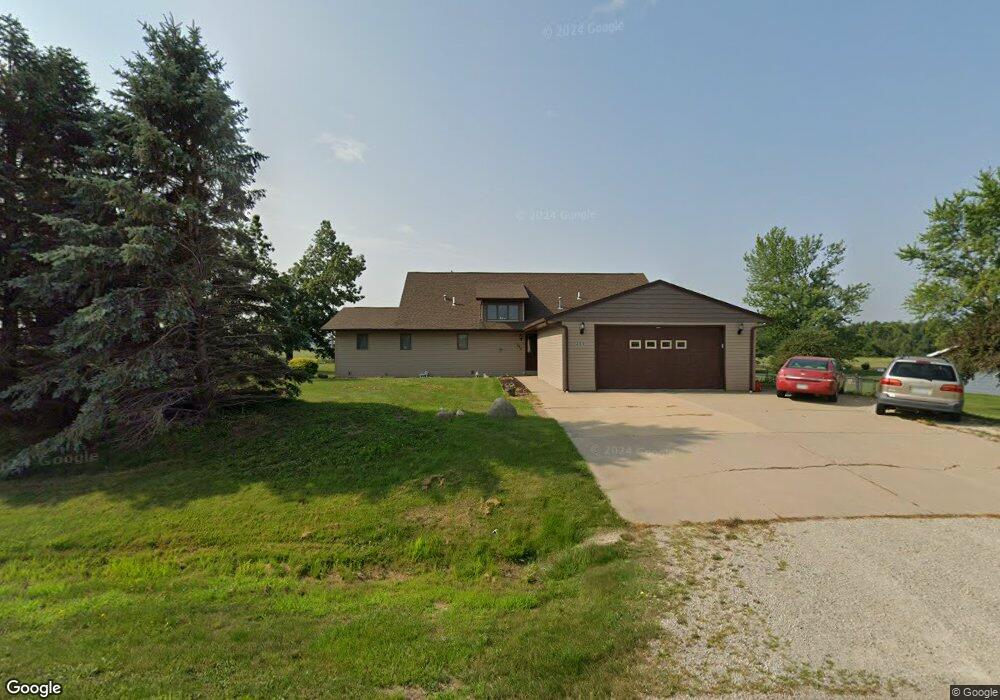
385 Freeseway Dr Robins, IA 52328
Estimated Value: $281,000 - $381,000
4
Beds
5
Baths
2,579
Sq Ft
$133/Sq Ft
Est. Value
About This Home
This home is located at 385 Freeseway Dr, Robins, IA 52328 and is currently estimated at $343,515, approximately $133 per square foot. 385 Freeseway Dr is a home located in Linn County with nearby schools including Nixon Elementary School, Harding Middle School, and John F. Kennedy High School.
Ownership History
Date
Name
Owned For
Owner Type
Purchase Details
Closed on
Jun 27, 2022
Sold by
Cleasby Richard A and Cleasby Kathryn J
Bought by
Fitch Kimberly M and Fitch Aaron L
Current Estimated Value
Home Financials for this Owner
Home Financials are based on the most recent Mortgage that was taken out on this home.
Original Mortgage
$18,550
Outstanding Balance
$12,527
Interest Rate
4.45%
Estimated Equity
$330,988
Create a Home Valuation Report for This Property
The Home Valuation Report is an in-depth analysis detailing your home's value as well as a comparison with similar homes in the area
Home Values in the Area
Average Home Value in this Area
Purchase History
| Date | Buyer | Sale Price | Title Company |
|---|---|---|---|
| Fitch Kimberly M | $265,000 | Estlund Tim A |
Source: Public Records
Mortgage History
| Date | Status | Borrower | Loan Amount |
|---|---|---|---|
| Open | Fitch Kimberly M | $18,550 | |
| Open | Fitch Kimberly M | $238,500 |
Source: Public Records
Tax History
| Year | Tax Paid | Tax Assessment Tax Assessment Total Assessment is a certain percentage of the fair market value that is determined by local assessors to be the total taxable value of land and additions on the property. | Land | Improvement |
|---|---|---|---|---|
| 2025 | $3,612 | $348,600 | $32,200 | $316,400 |
| 2024 | $3,800 | $286,700 | $32,200 | $254,500 |
| 2023 | $3,800 | $286,700 | $32,200 | $254,500 |
| 2022 | $4,044 | $258,200 | $32,200 | $226,000 |
| 2021 | $4,042 | $258,200 | $32,200 | $226,000 |
| 2020 | $4,042 | $239,700 | $32,200 | $207,500 |
| 2019 | $3,914 | $236,400 | $45,100 | $191,300 |
Source: Public Records
Map
Nearby Homes
- 165 Timber Ln
- 8926 Norway Dr NE
- 8932 Norway Dr NE
- 9124 Grand Oaks Dr NE
- 8608 Flatbush Ct NE
- 8201 Council St NE
- 70.78 Acres M L Quass Rd
- 1623 Petrus Dr NE
- 560 Ryker St
- 620 Hampton St
- 570 Hampton St
- 540 Hampton St
- 560 Hampton St
- 590 Hampton St
- 600 Hampton St
- 500 Hampton St
- 545 Hampton St
- 580 Hampton St
- 610 Hampton St
- 520 Hampton St
- 425 Freeseway Dr
- 345 Freeseway Dr
- 380 Freeseway Dr
- 465 Freeseway Dr
- 305 Freeseway Dr
- 420 Freeseway Dr
- 340 Freeseway Dr
- 460 Freeseway Dr
- 300 Freeseway Dr
- 385 Shannon Dr
- 505 Freeseway Dr
- 395 Shannon Dr
- 365 Shannon Dr
- 265 Freeseway Dr
- 455 Shannon Dr
- 435 Shannon Dr
- 445 Shannon Dr
- 750 Miles St
- 335 Shannon Dr
- 785 Miles St
Your Personal Tour Guide
Ask me questions while you tour the home.