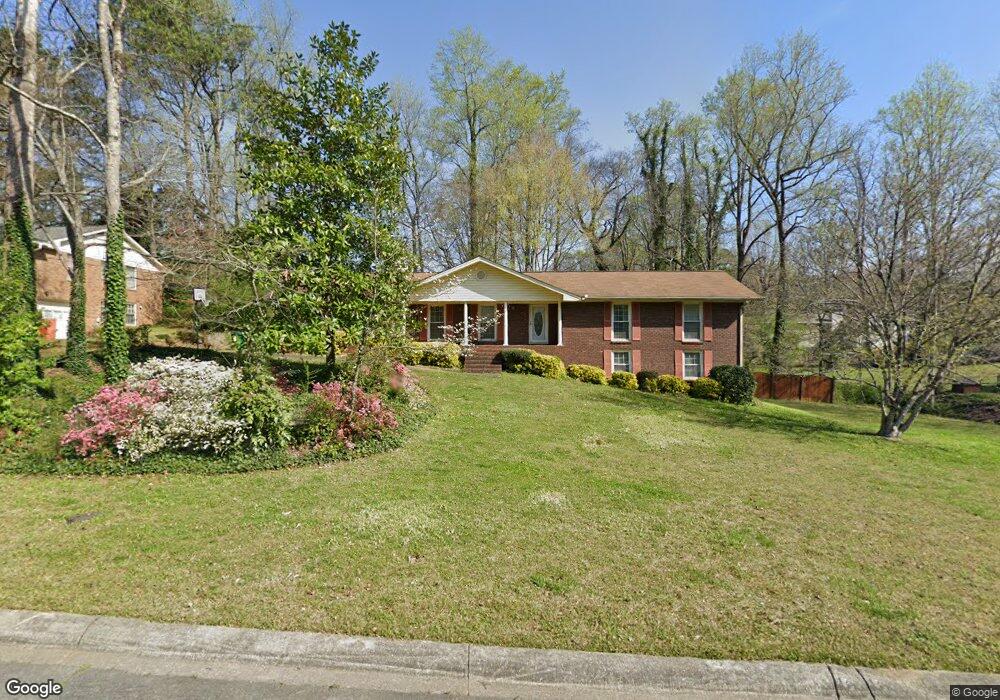
385 Lynhurst Rd SE Smyrna, GA 30082
Estimated Value: $448,364 - $546,000
3
Beds
2
Baths
1,537
Sq Ft
$333/Sq Ft
Est. Value
About This Home
This home is located at 385 Lynhurst Rd SE, Smyrna, GA 30082 and is currently estimated at $512,091, approximately $333 per square foot. 385 Lynhurst Rd SE is a home located in Cobb County with nearby schools including King Springs Elementary School, Griffin Middle School, and Campbell High School.
Create a Home Valuation Report for This Property
The Home Valuation Report is an in-depth analysis detailing your home's value as well as a comparison with similar homes in the area
Home Values in the Area
Average Home Value in this Area
Tax History Compared to Growth
Tax History
| Year | Tax Paid | Tax Assessment Tax Assessment Total Assessment is a certain percentage of the fair market value that is determined by local assessors to be the total taxable value of land and additions on the property. | Land | Improvement |
|---|---|---|---|---|
| 2025 | $500 | $187,632 | $40,000 | $147,632 |
| 2024 | $500 | $187,632 | $40,000 | $147,632 |
| 2023 | $347 | $157,972 | $28,000 | $129,972 |
| 2022 | $500 | $157,972 | $28,000 | $129,972 |
| 2021 | $516 | $126,236 | $28,000 | $98,236 |
| 2020 | $516 | $126,236 | $28,000 | $98,236 |
| 2019 | $515 | $117,484 | $24,000 | $93,484 |
| 2018 | $515 | $117,484 | $24,000 | $93,484 |
| 2017 | $413 | $104,972 | $24,000 | $80,972 |
| 2016 | $417 | $104,972 | $24,000 | $80,972 |
| 2015 | $452 | $82,528 | $24,000 | $58,528 |
| 2014 | $468 | $82,528 | $0 | $0 |
Source: Public Records
Map
Nearby Homes
- 317 Highview Dr SE
- 524 Tackett Farms Rd
- 3808 Concord Approach Way SE
- 418 Mockingbird Ln SE
- 362 Doeskin Ln SE
- 203 Angla Dr SE
- 436 Concord Rd SE
- 3933 N Cooper Lake Rd SE
- 465 Willowbrook Dr SE
- 538 Micayne Cir SE Unit 3
- 4135 Fawn Ln SE
- 550 Micayne Cir SE Unit 1
- 576 N Thomas Ln SE
- 4195 Antler Trail SE
- 1522 Grace Meadows Ln SE
- 1375 Mosswood Ln SE
- 4222 Terrace Ct SE
- 0 Lynhurst Rd Unit 7519586
- 0 Lynhurst Rd Unit 7079439
- 0 Lynhurst Rd
- 373 Lynhurst Rd SE
- 407 Lynhurst Rd SE Unit 4
- 386 Highview Dr SE
- 374 Highview Dr SE
- 404 Highview Dr SE
- 357 Lynhurst Rd SE Unit 4
- 384 Lynhurst Rd SE
- 374 Lynhurst Rd SE
- 374 Lynhurst Rd SE Unit IV
- 406 Lynhurst Rd SE
- 360 Highview Dr SE
- 360 Lynhurst Rd SE
- 417 Lynhurst Rd SE
- 394 Lynhurst Rd SE
- 418 Highview Dr SE
- 3902 Cloudland Dr SE
- 348 Lynhurst Rd SE