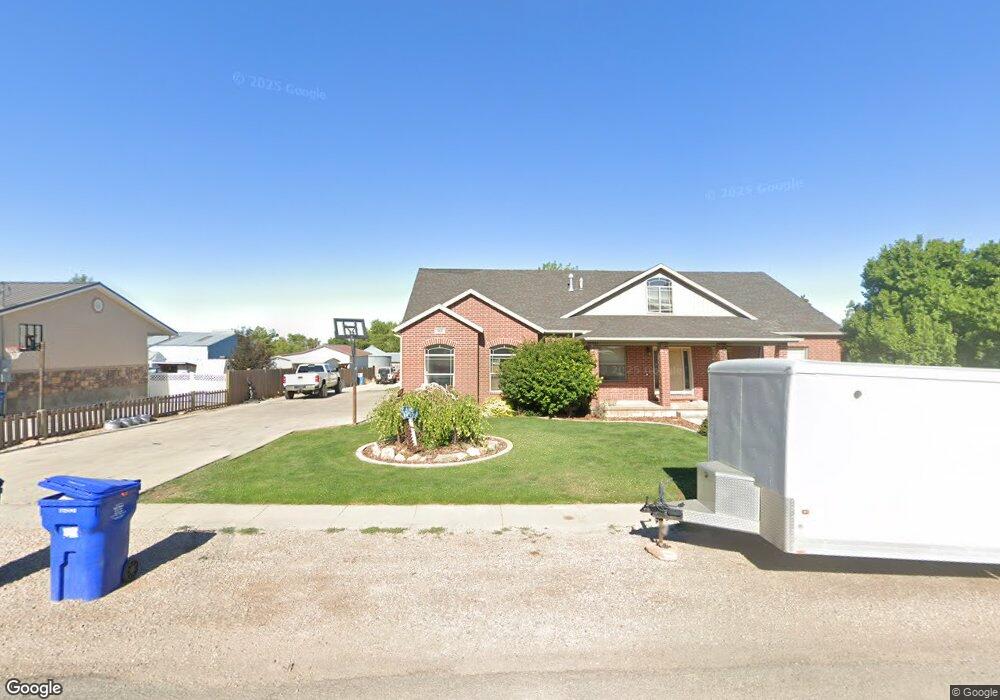
385 N 100 E Fillmore, UT 84631
Estimated Value: $83,000 - $838,000
Studio
--
Bath
--
Sq Ft
18,295
Sq Ft Lot
About This Home
This home is located at 385 N 100 E, Fillmore, UT 84631 and is currently estimated at $477,267. 385 N 100 E is a home.
Ownership History
Date
Name
Owned For
Owner Type
Purchase Details
Closed on
Nov 14, 2023
Sold by
Deaden James G and Deaden Kami
Bought by
Deerden James G
Current Estimated Value
Purchase Details
Closed on
Mar 10, 2008
Sold by
Dearden Kamalyn
Bought by
Dearden James G and Dearden Kami
Home Financials for this Owner
Home Financials are based on the most recent Mortgage that was taken out on this home.
Original Mortgage
$188,000
Interest Rate
5.65%
Mortgage Type
New Conventional
Create a Home Valuation Report for This Property
The Home Valuation Report is an in-depth analysis detailing your home's value as well as a comparison with similar homes in the area
Home Values in the Area
Average Home Value in this Area
Purchase History
| Date | Buyer | Sale Price | Title Company |
|---|---|---|---|
| Deerden James G | -- | None Listed On Document | |
| Dearden James G | -- | -- |
Source: Public Records
Mortgage History
| Date | Status | Borrower | Loan Amount |
|---|---|---|---|
| Previous Owner | Dearden James G | $188,000 |
Source: Public Records
Tax History
| Year | Tax Paid | Tax Assessment Tax Assessment Total Assessment is a certain percentage of the fair market value that is determined by local assessors to be the total taxable value of land and additions on the property. | Land | Improvement |
|---|---|---|---|---|
| 2025 | $3,474 | $436,340 | $33,683 | $402,657 |
| 2024 | $3,474 | $382,225 | $17,070 | $365,155 |
| 2023 | $4,019 | $382,225 | $17,070 | $365,155 |
| 2022 | $3,057 | $274,533 | $15,518 | $259,015 |
| 2021 | $2,796 | $241,071 | $12,932 | $228,139 |
| 2020 | $2,457 | $213,076 | $11,756 | $201,320 |
| 2019 | $2,063 | $179,455 | $11,756 | $167,699 |
| 2018 | $1,956 | $174,176 | $11,756 | $162,420 |
| 2017 | $2,021 | $171,016 | $11,550 | $159,466 |
| 2016 | $1,932 | $171,016 | $11,550 | $159,466 |
| 2015 | $1,722 | $152,324 | $11,550 | $140,774 |
| 2014 | -- | $152,324 | $11,550 | $140,774 |
| 2013 | -- | $152,324 | $11,550 | $140,774 |
Source: Public Records
Map
Nearby Homes
- 390 N 100 W
- 245 W 300 N
- 75 N 100 West St
- 225 W 200 St N
- 40 S 100 Rd E
- 335 W 400 North St
- 155 W Center St
- 220 S 200 E
- 235 S 200 St E
- 351 W 100 South St
- 260 W 200 S
- 410 W 400 N
- 2155 N Cedar Mountain Rd
- 2835 N Cedar Mountain Rd
- 600 E 1200 St N
- 465 S 100 W
- 155 E 500 St S
- 157 E 500 South St
- 405 E 500 St S
- 310 S 500 West Rd
Your Personal Tour Guide
Ask me questions while you tour the home.