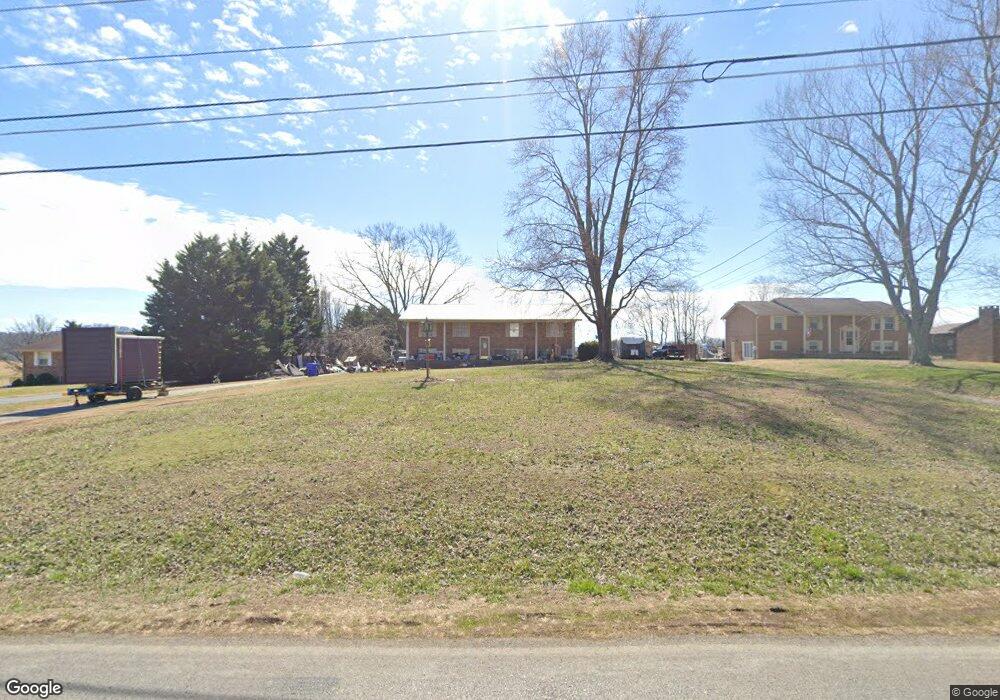
385 N Chucky Pike Jefferson City, TN 37760
Estimated Value: $301,807 - $386,000
3
Beds
2
Baths
1,977
Sq Ft
$178/Sq Ft
Est. Value
About This Home
This home is located at 385 N Chucky Pike, Jefferson City, TN 37760 and is currently estimated at $350,952, approximately $177 per square foot. 385 N Chucky Pike is a home located in Jefferson County.
Ownership History
Date
Name
Owned For
Owner Type
Purchase Details
Closed on
May 20, 2011
Sold by
Secretary Of Housing And U
Bought by
Stepp Salem L and Odham James T
Current Estimated Value
Home Financials for this Owner
Home Financials are based on the most recent Mortgage that was taken out on this home.
Original Mortgage
$78,000
Outstanding Balance
$53,981
Interest Rate
4.79%
Mortgage Type
Commercial
Estimated Equity
$296,971
Purchase Details
Closed on
Oct 13, 2010
Sold by
Gmac Mtg Llc
Bought by
Sec Dept Of Housing Urban Dev
Purchase Details
Closed on
May 20, 2010
Sold by
Robbins Johnny Wayne
Bought by
Sec Dept Of Housing Urban Dev
Purchase Details
Closed on
Dec 22, 1997
Bought by
Johnny Robbins
Home Financials for this Owner
Home Financials are based on the most recent Mortgage that was taken out on this home.
Original Mortgage
$50,000
Interest Rate
7.2%
Purchase Details
Closed on
Mar 20, 1997
Sold by
Clay French
Bought by
Mark Bissell
Home Financials for this Owner
Home Financials are based on the most recent Mortgage that was taken out on this home.
Original Mortgage
$81,600
Interest Rate
7.69%
Purchase Details
Closed on
Jan 6, 1997
Sold by
Kenneth Ballew Fred
Bought by
Clay French
Purchase Details
Closed on
Jan 1, 1984
Bought by
Ballew Fred Kenneth and Patsy Cate
Create a Home Valuation Report for This Property
The Home Valuation Report is an in-depth analysis detailing your home's value as well as a comparison with similar homes in the area
Home Values in the Area
Average Home Value in this Area
Purchase History
| Date | Buyer | Sale Price | Title Company |
|---|---|---|---|
| Stepp Salem L | $87,000 | -- | |
| Sec Dept Of Housing Urban Dev | -- | -- | |
| Sec Dept Of Housing Urban Dev | $171,605 | -- | |
| Johnny Robbins | $125,000 | -- | |
| Mark Bissell | $102,000 | -- | |
| Clay French | $30,000 | -- | |
| Ballew Fred Kenneth | $62,000 | -- |
Source: Public Records
Mortgage History
| Date | Status | Borrower | Loan Amount |
|---|---|---|---|
| Open | Stepp Salem L | $78,000 | |
| Previous Owner | Ballew Fred Kenneth | $50,000 | |
| Previous Owner | Ballew Fred Kenneth | $81,600 |
Source: Public Records
Tax History Compared to Growth
Tax History
| Year | Tax Paid | Tax Assessment Tax Assessment Total Assessment is a certain percentage of the fair market value that is determined by local assessors to be the total taxable value of land and additions on the property. | Land | Improvement |
|---|---|---|---|---|
| 2025 | $1,005 | $70,300 | $8,500 | $61,800 |
| 2023 | $896 | $38,975 | $0 | $0 |
| 2022 | $854 | $38,975 | $5,750 | $33,225 |
| 2021 | $854 | $38,975 | $5,750 | $33,225 |
| 2020 | $854 | $38,975 | $5,750 | $33,225 |
| 2019 | $854 | $38,975 | $5,750 | $33,225 |
| 2018 | $841 | $35,775 | $5,750 | $30,025 |
| 2017 | $841 | $35,775 | $5,750 | $30,025 |
| 2016 | $841 | $35,775 | $5,750 | $30,025 |
| 2015 | $841 | $35,775 | $5,750 | $30,025 |
| 2014 | $841 | $35,775 | $5,750 | $30,025 |
Source: Public Records
Map
Nearby Homes
- Lot 18 Kaylee Dr
- 1336 Tom Breeden Rd
- 144 Snowbird Ln Unit 13
- 144 Snowbird Ln
- 1946 Kaylee Dr
- 1961 Kaylee Dr
- 1991 Kaylee Dr
- 1601 Mossy Oak Dr
- 1001 Dumplin Valley Rd E
- 664 Oxford Rd
- Parcel 086 N Chucky Pike
- 846 N Chucky Pike
- 747 E Dumplin Valley Rd
- Lot 0 Talbott-Kansas Rd
- 2013 Phagan Rd
- 1211 Debrex Dr
- 881 Greene Meadow Dr
- 877 Greene Meadow Dr
- 864 Greene Meadow Dr
- 1202 Deer Ln
- 389 N Chucky Pike
- 381 N Chucky Pike
- 393 N Chucky Pike
- 0 N Chucky Pike
- 388 N Chucky Pike
- 397 N Chucky Pike
- 940 Preston Rd
- 384 N Chucky Pike
- 936 Preston Rd
- 1906 Kaylee Dr
- 382 N Chucky Pike
- 939 Preston Rd Unit S/D CHUCKY ESTATES
- 939 Preston Rd
- 1910 Kaylee Dr
- 380 N Chucky Pike
- 1306 Summer Ln
- 1308 Summer Ln
- 378 N Chucky Pike
- 1302 Summer Ln
- 420 N Chucky Pike