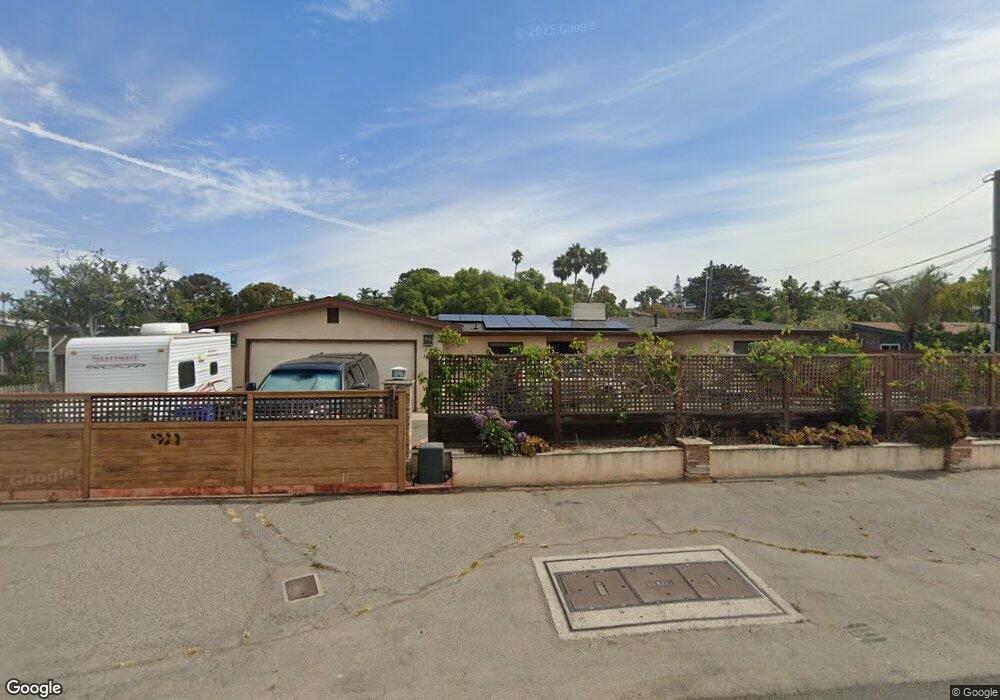
385 N Vulcan Ave Encinitas, CA 92024
Central Encinitas NeighborhoodEstimated Value: $1,771,000 - $2,346,959
3
Beds
2
Baths
1,665
Sq Ft
$1,228/Sq Ft
Est. Value
About This Home
This home is located at 385 N Vulcan Ave, Encinitas, CA 92024 and is currently estimated at $2,044,490, approximately $1,227 per square foot. 385 N Vulcan Ave is a home located in San Diego County with nearby schools including Paul Ecke-Central Elementary, Diegueno Middle School, and La Costa Canyon High School.
Ownership History
Date
Name
Owned For
Owner Type
Purchase Details
Closed on
Jun 29, 1998
Sold by
Carlsson Sven G and Cleveland Judy L
Bought by
Sirota Gary L and Bailis Robyn
Current Estimated Value
Home Financials for this Owner
Home Financials are based on the most recent Mortgage that was taken out on this home.
Original Mortgage
$204,000
Outstanding Balance
$32,093
Interest Rate
4.25%
Estimated Equity
$2,012,397
Purchase Details
Closed on
Dec 19, 1997
Sold by
Carlsson Sven G
Bought by
Carlsson Sven G
Purchase Details
Closed on
Jul 8, 1997
Sold by
Mario Zanelli
Bought by
Carlsson Sven G and Cleveland Judy L
Purchase Details
Closed on
Oct 24, 1994
Sold by
Great Western Bank
Bought by
Zanelli Mario and Zanelli Sue
Home Financials for this Owner
Home Financials are based on the most recent Mortgage that was taken out on this home.
Original Mortgage
$114,000
Interest Rate
8.9%
Purchase Details
Closed on
Jun 7, 1994
Sold by
California Reconveyance Company
Bought by
Great Western Bank
Create a Home Valuation Report for This Property
The Home Valuation Report is an in-depth analysis detailing your home's value as well as a comparison with similar homes in the area
Home Values in the Area
Average Home Value in this Area
Purchase History
| Date | Buyer | Sale Price | Title Company |
|---|---|---|---|
| Sirota Gary L | $255,000 | Fidelity National Title | |
| Carlsson Sven G | -- | -- | |
| Carlsson Sven G | $300,000 | First American Title | |
| Zanelli Mario | $152,000 | Chicago Title | |
| Great Western Bank | $123,475 | Chicago Title Company |
Source: Public Records
Mortgage History
| Date | Status | Borrower | Loan Amount |
|---|---|---|---|
| Open | Sirota Gary L | $204,000 | |
| Previous Owner | Zanelli Mario | $114,000 | |
| Closed | Sirota Gary L | $25,500 |
Source: Public Records
Tax History
| Year | Tax Paid | Tax Assessment Tax Assessment Total Assessment is a certain percentage of the fair market value that is determined by local assessors to be the total taxable value of land and additions on the property. | Land | Improvement |
|---|---|---|---|---|
| 2025 | $4,667 | $399,747 | $156,761 | $242,986 |
| 2024 | $4,667 | $391,910 | $153,688 | $238,222 |
| 2023 | $4,511 | $384,226 | $150,675 | $233,551 |
| 2022 | $4,387 | $376,693 | $147,721 | $228,972 |
| 2021 | $4,297 | $369,308 | $144,825 | $224,483 |
| 2020 | $4,213 | $365,522 | $143,340 | $222,182 |
| 2019 | $4,132 | $358,356 | $140,530 | $217,826 |
| 2018 | $4,055 | $351,330 | $137,775 | $213,555 |
| 2017 | $194 | $344,442 | $135,074 | $209,368 |
| 2016 | $3,866 | $337,689 | $132,426 | $205,263 |
| 2015 | $3,784 | $332,617 | $130,437 | $202,180 |
| 2014 | $3,688 | $326,102 | $127,882 | $198,220 |
Source: Public Records
Map
Nearby Homes
- 215 N Vulcan Ave
- 523 N Vulcan Ave Unit SPC 24A
- 523 N Vulcan Ave Unit 3
- 523 N Vulcan Ave Unit 41
- 523 N Vulcan Ave Unit 43
- 200 Neptune Ave Unit 2
- 569 Hermes Ave
- 553 Hygeia Ave
- 498 Neptune Ave
- 510 Neptune Ave
- 100 5th St
- 600 N Coast Highway 101
- 614 Ocean View Ave
- 201 4th St Unit A & B
- 90 N Coast Highway 101 Unit 310
- 90 N Coast Highway 101
- 231 5th St
- 698 Hygeia Ave
- 697 Ocean View Ave
- 370 Carmel Creeper Place Unit 8
- 397 1/2 N Vulcan Ave
- 377 N Vulcan Ave Unit 79
- 381 N Vulcan Ave
- 373 N Vulcan Ave
- 2 Halcyon Rd
- 359 N Vulcan Ave
- 189 Halcyon Rd
- 0000 Hwy 101
- 349 N Vulcan Ave Unit B
- 349 N Vulcan Ave
- 388 Orpheus Ave Unit A
- 337 N Vulcan Ave
- 182 Halcyon Rd
- 327 N Vulcan Ave
- 398 Orpheus Ave
- 340 Orpheus Ave
- 191 Halcyon Rd Unit 191A
- 362 Orpheus Ave
- 396 Orpheus Ave
- 187 Halcyon Rd Unit A
Your Personal Tour Guide
Ask me questions while you tour the home.