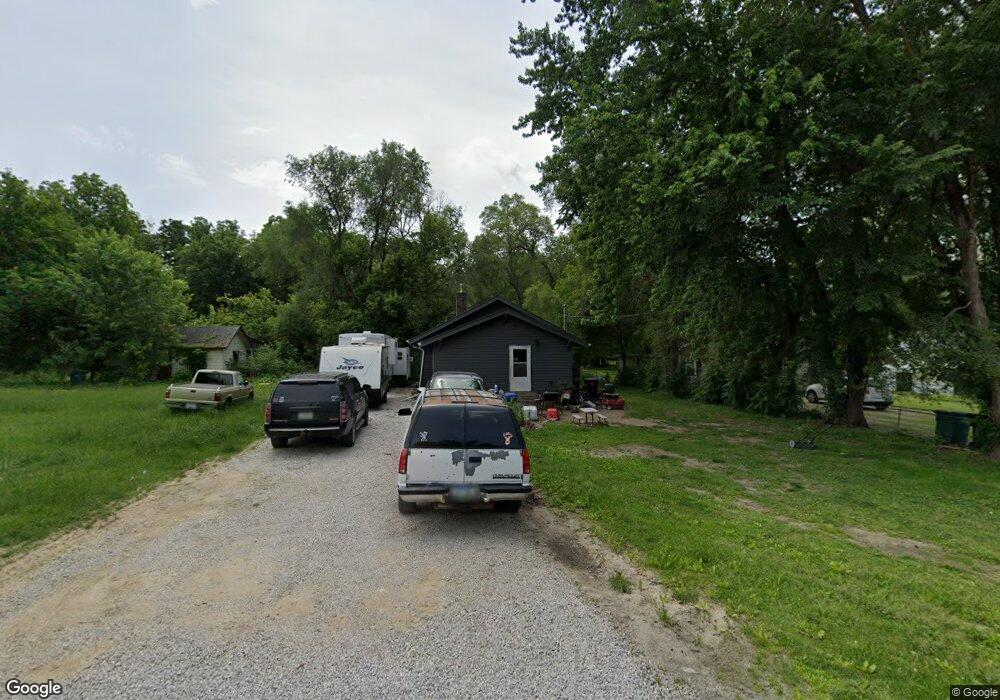
385 NE 43rd Ave Des Moines, IA 50313
Marquisville NeighborhoodEstimated Value: $109,000 - $148,000
2
Beds
1
Bath
768
Sq Ft
$179/Sq Ft
Est. Value
About This Home
This home is located at 385 NE 43rd Ave, Des Moines, IA 50313 and is currently estimated at $137,385, approximately $178 per square foot. 385 NE 43rd Ave is a home located in Polk County with nearby schools including Cornell Elementary School, Woodside Middle School, and Saydel High School.
Ownership History
Date
Name
Owned For
Owner Type
Purchase Details
Closed on
Mar 31, 2023
Sold by
Lamb Investments Llc
Bought by
Leverich Gail Lee James and Leverich Marjean Lucille
Current Estimated Value
Home Financials for this Owner
Home Financials are based on the most recent Mortgage that was taken out on this home.
Original Mortgage
$22,340
Outstanding Balance
$21,687
Interest Rate
6.32%
Mortgage Type
New Conventional
Estimated Equity
$115,698
Purchase Details
Closed on
Nov 30, 2000
Sold by
Indvik Maureen and Jensen Jeffrey D
Bought by
Lamb Investments Llc
Create a Home Valuation Report for This Property
The Home Valuation Report is an in-depth analysis detailing your home's value as well as a comparison with similar homes in the area
Home Values in the Area
Average Home Value in this Area
Purchase History
| Date | Buyer | Sale Price | Title Company |
|---|---|---|---|
| Leverich Gail Lee James | $45,000 | -- | |
| Lamb Investments Llc | -- | -- | |
| Lamb Investments Llc | $12,000 | -- |
Source: Public Records
Mortgage History
| Date | Status | Borrower | Loan Amount |
|---|---|---|---|
| Open | Leverich Gail Lee James | $22,340 |
Source: Public Records
Tax History Compared to Growth
Tax History
| Year | Tax Paid | Tax Assessment Tax Assessment Total Assessment is a certain percentage of the fair market value that is determined by local assessors to be the total taxable value of land and additions on the property. | Land | Improvement |
|---|---|---|---|---|
| 2025 | $1,420 | $111,900 | $48,500 | $63,400 |
| 2024 | $1,420 | $103,600 | $44,800 | $58,800 |
| 2023 | $1,334 | $103,600 | $44,800 | $58,800 |
| 2022 | $1,312 | $81,900 | $36,100 | $45,800 |
| 2021 | $1,248 | $81,900 | $36,100 | $45,800 |
| 2020 | $1,232 | $73,600 | $32,200 | $41,400 |
| 2019 | $1,192 | $73,600 | $32,200 | $41,400 |
| 2018 | $1,168 | $68,600 | $29,400 | $39,200 |
| 2017 | $1,200 | $68,600 | $29,400 | $39,200 |
| 2016 | $1,114 | $65,300 | $27,600 | $37,700 |
| 2015 | $1,114 | $65,300 | $27,600 | $37,700 |
| 2014 | $1,092 | $65,000 | $26,900 | $38,100 |
Source: Public Records
Map
Nearby Homes
- 405 NE 43rd Ave
- 365 NE 43rd Ave
- 425 NE 43rd Ave
- 345 NE 43rd Ave
- 445 NE 43rd Ave
- 325 NE 43rd Ave
- 4265 NE 3rd St
- 380 NE 43rd Ave
- 410 NE 43rd Ave
- 360 NE 43rd Ave
- 420 NE 43rd Ave
- 485 NE 43rd Ave
- 340 NE 43rd Ave
- 4255 NE 3rd St
- 310 NE 43rd Ave
- 440 NE 43rd Ave
- 320 NE 43rd Ave
- 460 NE 43rd Ave
- 4235 NE 3rd St
- 360 & 340 NE Aurora Ave