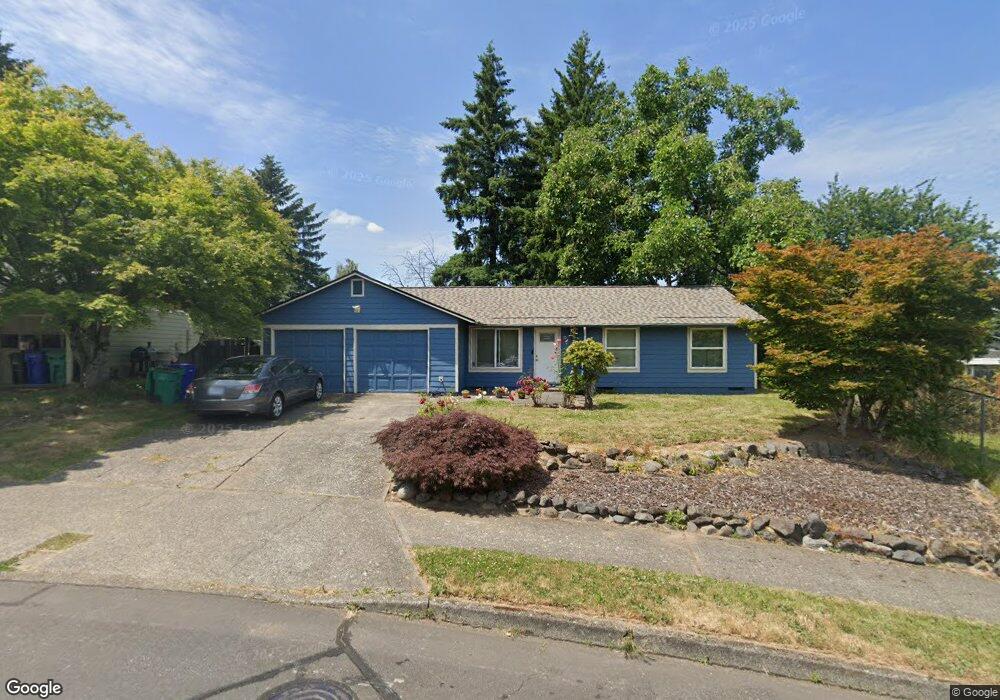
385 NE Hale Dr Gresham, OR 97030
Powell Valley NeighborhoodEstimated Value: $394,000 - $411,000
4
Beds
2
Baths
1,174
Sq Ft
$343/Sq Ft
Est. Value
About This Home
This home is located at 385 NE Hale Dr, Gresham, OR 97030 and is currently estimated at $402,957, approximately $343 per square foot. 385 NE Hale Dr is a home located in Multnomah County with nearby schools including Powell Valley Elementary School, Gordon Russell Middle School, and Sam Barlow High School.
Ownership History
Date
Name
Owned For
Owner Type
Purchase Details
Closed on
Mar 17, 2009
Sold by
Chrisman Charles D
Bought by
Chrisman Charles D and Chrisman Shinobu S
Current Estimated Value
Home Financials for this Owner
Home Financials are based on the most recent Mortgage that was taken out on this home.
Original Mortgage
$170,000
Outstanding Balance
$107,977
Interest Rate
5.19%
Mortgage Type
Stand Alone Refi Refinance Of Original Loan
Estimated Equity
$294,980
Purchase Details
Closed on
Dec 18, 2000
Sold by
Matthews Michiko
Bought by
Chrisman Charles D and Chrisman Shinobu S
Home Financials for this Owner
Home Financials are based on the most recent Mortgage that was taken out on this home.
Original Mortgage
$121,498
Interest Rate
7.71%
Mortgage Type
FHA
Purchase Details
Closed on
Jun 28, 1995
Sold by
Shaver Kenneth G and Shaver Verna R
Bought by
Matthews Billie G and Matthews Michiko
Home Financials for this Owner
Home Financials are based on the most recent Mortgage that was taken out on this home.
Original Mortgage
$82,800
Interest Rate
7.88%
Mortgage Type
Purchase Money Mortgage
Create a Home Valuation Report for This Property
The Home Valuation Report is an in-depth analysis detailing your home's value as well as a comparison with similar homes in the area
Home Values in the Area
Average Home Value in this Area
Purchase History
| Date | Buyer | Sale Price | Title Company |
|---|---|---|---|
| Chrisman Charles D | -- | Fidelity Natl Title Co Of Or | |
| Chrisman Charles D | $122,500 | Transnation Title Insurance | |
| Matthews Billie G | $103,500 | Stewart Title |
Source: Public Records
Mortgage History
| Date | Status | Borrower | Loan Amount |
|---|---|---|---|
| Open | Chrisman Charles D | $170,000 | |
| Closed | Chrisman Charles D | $121,498 | |
| Previous Owner | Matthews Billie G | $82,800 |
Source: Public Records
Tax History
| Year | Tax Paid | Tax Assessment Tax Assessment Total Assessment is a certain percentage of the fair market value that is determined by local assessors to be the total taxable value of land and additions on the property. | Land | Improvement |
|---|---|---|---|---|
| 2025 | $4,015 | $197,290 | -- | -- |
| 2024 | $3,843 | $191,550 | -- | -- |
| 2023 | $3,843 | $185,980 | -- | -- |
| 2022 | $3,404 | $180,570 | $0 | $0 |
| 2021 | $3,318 | $175,320 | $0 | $0 |
| 2020 | $3,122 | $170,220 | $0 | $0 |
| 2019 | $3,041 | $165,270 | $0 | $0 |
| 2018 | $2,899 | $160,460 | $0 | $0 |
| 2017 | $2,782 | $155,790 | $0 | $0 |
| 2016 | $2,453 | $151,260 | $0 | $0 |
| 2015 | $2,400 | $146,860 | $0 | $0 |
| 2014 | $2,341 | $142,590 | $0 | $0 |
Source: Public Records
Map
Nearby Homes
- 3454 NE 5th Ct
- 180 NE Kane Dr Unit 180
- 445 NE Village Squire Ave Unit 4
- 2811 NE 6th St
- 275 NE Scott Dr
- 2632 NE 7th Ct
- 361 NE Village Squire Ave Unit 4
- 3545 SE 1st St
- 251 NE Village Squire Ave Unit 2
- 251 NE Village Squire Ave Unit 15
- 4636 SE 2nd St
- 4690 SE 2nd St
- 4668 SE 2nd St
- 2980 NE Division St Unit 31
- 2980 NE Division St Unit 13
- 2980 NE Division St Unit 43
- 205 SE Olvera Ave
- 820 NE Cochran Ave
- 0 SE 1st St
- 3825 NE 2nd St
- 355 NE Hale Dr
- 395 NE Paropa Way
- 3300 NE Robin Ct
- 3280 NE Robin Ct
- 399 NE Paropa Way
- 3220 NE Robin Ct
- 3085 NE 3rd St
- 380 NE Hale Dr
- 3210 NE Robin Ct
- 310 NE Hale Dr
- 380 NE Paropa Way
- 360 NE Paropa Way
- 390 NE Paropa Way
- 425 NE Paropa Way
- 290 NE Hale Dr
- 430 NE Paropa Way
- 325 NE Paropa Way
- 3015 NE 3rd St
- 3285 NE Robin Ct
- 3225 NE Robin Ct
Your Personal Tour Guide
Ask me questions while you tour the home.