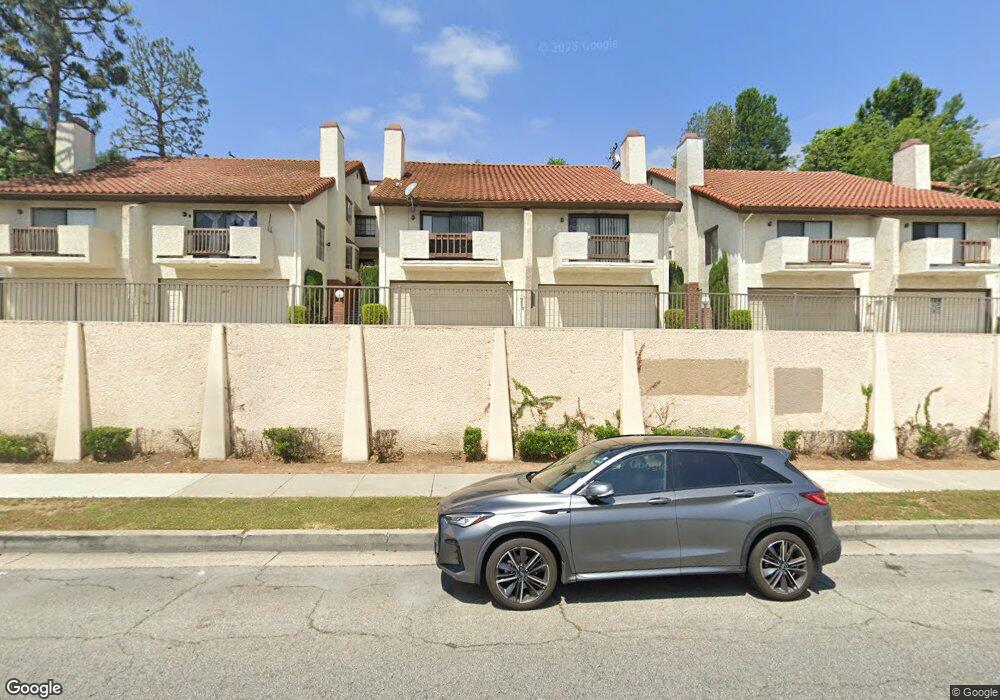
385 S Atlantic Blvd Unit E Monterey Park, CA 91754
Estimated Value: $653,000 - $969,000
4
Beds
3
Baths
1,601
Sq Ft
$507/Sq Ft
Est. Value
About This Home
This home is located at 385 S Atlantic Blvd Unit E, Monterey Park, CA 91754 and is currently estimated at $811,277, approximately $506 per square foot. 385 S Atlantic Blvd Unit E is a home located in Los Angeles County with nearby schools including Monterey Highlands Elementary School, Mark Keppel High School, and St. Stephen Martyr School.
Ownership History
Date
Name
Owned For
Owner Type
Purchase Details
Closed on
Jan 5, 2023
Sold by
Chu Tam Fong
Bought by
Tam Fong Chu
Current Estimated Value
Purchase Details
Closed on
Jun 11, 1998
Sold by
Federal National Mortgage Association
Bought by
Tam Fong Chu
Home Financials for this Owner
Home Financials are based on the most recent Mortgage that was taken out on this home.
Original Mortgage
$118,000
Interest Rate
7.03%
Purchase Details
Closed on
Oct 24, 1997
Sold by
Feng Lei J and Federal National Mortgage Asso
Bought by
Federal National Mortgage Association
Purchase Details
Closed on
Nov 19, 1993
Sold by
Feng Jui Ma
Bought by
Feng Lei Jun
Home Financials for this Owner
Home Financials are based on the most recent Mortgage that was taken out on this home.
Original Mortgage
$8,700
Interest Rate
7.16%
Create a Home Valuation Report for This Property
The Home Valuation Report is an in-depth analysis detailing your home's value as well as a comparison with similar homes in the area
Home Values in the Area
Average Home Value in this Area
Purchase History
| Date | Buyer | Sale Price | Title Company |
|---|---|---|---|
| Tam Fong Chu | -- | Chicago Title Company | |
| Tam Fong Chu | $148,000 | American Title Co | |
| Federal National Mortgage Association | $131,027 | Stewart Title | |
| Feng Lei Jun | -- | World Title |
Source: Public Records
Mortgage History
| Date | Status | Borrower | Loan Amount |
|---|---|---|---|
| Previous Owner | Tam Fong Chu | $118,000 | |
| Previous Owner | Feng Lei Jun | $8,700 |
Source: Public Records
Tax History Compared to Growth
Tax History
| Year | Tax Paid | Tax Assessment Tax Assessment Total Assessment is a certain percentage of the fair market value that is determined by local assessors to be the total taxable value of land and additions on the property. | Land | Improvement |
|---|---|---|---|---|
| 2025 | $3,370 | $242,969 | $62,695 | $180,274 |
| 2024 | $3,370 | $238,206 | $61,466 | $176,740 |
| 2023 | $3,302 | $233,536 | $60,261 | $173,275 |
| 2022 | $3,151 | $228,958 | $59,080 | $169,878 |
| 2021 | $3,106 | $224,470 | $57,922 | $166,548 |
| 2019 | $2,999 | $217,814 | $56,205 | $161,609 |
| 2018 | $2,997 | $213,544 | $55,103 | $158,441 |
| 2017 | $2,979 | $209,358 | $54,023 | $155,335 |
| 2016 | $2,778 | $205,254 | $52,964 | $152,290 |
| 2015 | $2,736 | $202,172 | $52,169 | $150,003 |
| 2014 | $2,704 | $198,213 | $51,148 | $147,065 |
Source: Public Records
Map
Nearby Homes
- 408 De la Fuente St
- 419 S Chandler Ave Unit 521
- 311 Montechico Dr
- 1141 Williams St
- 651 Villa Monte Ave
- 0 Garvey Ave Unit MB21123625
- 259 Fremont Ave
- 2409 Siwanoy Dr
- 824 De la Fuente St
- 701 S Garfield Ave
- 421 S Garfield Ave Unit 79
- 218 N Mc Pherrin Ave
- 419 N Chandler Ave Unit 508
- 419 N Chandler Ave Unit 311
- 419 N Chandler Ave Unit 308
- 419 N Chandler Ave Unit 413
- 419 N Chandler Ave Unit 305
- 419 N Chandler Ave Unit 319
- 438 S Garfield Ave Unit E
- 513 N Chandler Ave Unit E
- 385 S Atlantic Blvd Unit F
- 385 S Atlantic Blvd Unit A
- 385 S Atlantic Blvd Unit B
- 385 S Atlantic Blvd Unit C
- 385 S Atlantic Blvd Unit D
- 385 S Atlantic Blvd
- 344 De la Fuente St
- 346 De la Fuente St
- 340 De la Fuente St
- 365 S Atlantic Blvd
- 365 S Atlantic Blvd Unit A
- 365 S Atlantic Blvd Unit B
- 365 S Atlantic Blvd Unit C
- 365 S Atlantic Blvd Unit D
- 365 S Atlantic Blvd Unit E
- 365 S Atlantic Blvd Unit F
- 336 De la Fuente St
- 350 De la Fuente St
- 404 De la Fuente St
- 330 De la Fuente St