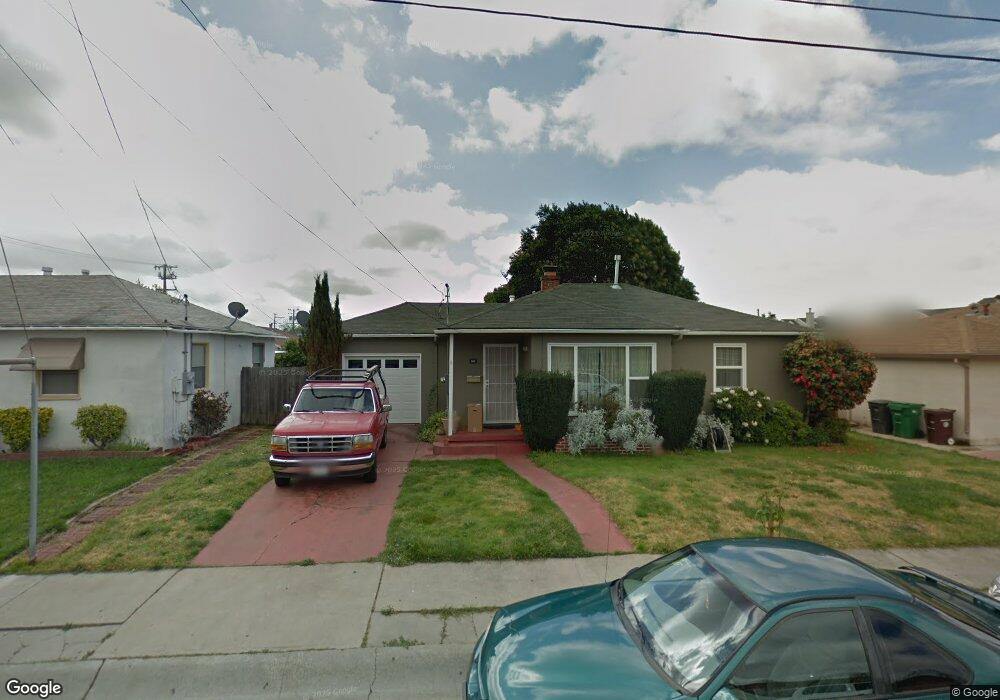
385 Saint George St Hayward, CA 94541
Estimated Value: $711,000 - $764,000
2
Beds
1
Bath
920
Sq Ft
$804/Sq Ft
Est. Value
About This Home
This home is located at 385 Saint George St, Hayward, CA 94541 and is currently estimated at $739,954, approximately $804 per square foot. 385 Saint George St is a home located in Alameda County with nearby schools including Winton Middle School, Hayward High School, and St. John Catholic School.
Ownership History
Date
Name
Owned For
Owner Type
Purchase Details
Closed on
Jul 22, 2014
Sold by
Sherlock Basil J and Moller Sherlock Ingrid
Bought by
Ruiz David and Ruiz Rafael
Current Estimated Value
Home Financials for this Owner
Home Financials are based on the most recent Mortgage that was taken out on this home.
Original Mortgage
$388,550
Outstanding Balance
$295,959
Interest Rate
4.16%
Mortgage Type
New Conventional
Estimated Equity
$443,995
Purchase Details
Closed on
May 3, 2004
Sold by
Moller Sherlock Basil J and Moller Sherlock Ingrid
Bought by
Sherlock Basil J and Moller Sherlock Ingrid
Create a Home Valuation Report for This Property
The Home Valuation Report is an in-depth analysis detailing your home's value as well as a comparison with similar homes in the area
Home Values in the Area
Average Home Value in this Area
Purchase History
| Date | Buyer | Sale Price | Title Company |
|---|---|---|---|
| Ruiz David | $409,000 | North American Title Co Inc | |
| Sherlock Basil J | -- | -- |
Source: Public Records
Mortgage History
| Date | Status | Borrower | Loan Amount |
|---|---|---|---|
| Open | Ruiz David | $388,550 |
Source: Public Records
Tax History Compared to Growth
Tax History
| Year | Tax Paid | Tax Assessment Tax Assessment Total Assessment is a certain percentage of the fair market value that is determined by local assessors to be the total taxable value of land and additions on the property. | Land | Improvement |
|---|---|---|---|---|
| 2025 | $6,523 | $491,540 | $147,462 | $344,078 |
| 2024 | $6,523 | $481,903 | $144,571 | $337,332 |
| 2023 | $6,457 | $472,455 | $141,736 | $330,719 |
| 2022 | $6,308 | $463,191 | $138,957 | $324,234 |
| 2021 | $6,230 | $454,111 | $136,233 | $317,878 |
| 2020 | $6,132 | $449,457 | $134,837 | $314,620 |
| 2019 | $6,157 | $440,647 | $132,194 | $308,453 |
| 2018 | $5,782 | $432,010 | $129,603 | $302,407 |
| 2017 | $5,639 | $423,538 | $127,061 | $296,477 |
| 2016 | $5,316 | $415,237 | $124,571 | $290,666 |
| 2015 | $5,201 | $409,000 | $122,700 | $286,300 |
| 2014 | $2,458 | $172,004 | $98,265 | $73,739 |
Source: Public Records
Map
Nearby Homes
- 20923 Haviland Ave
- 550 Blossom Way
- 263 Medford Ave
- 436 Grove Way
- 19641 Medford Cir Unit 5
- 19884 Meekland Ave
- 641 Jordan Way
- 823 Blossom Way
- 21564 Meekland Ave Unit 1
- 347 Willow Ave Unit 6
- 19539 Meekland Ave
- 18905 Standish Ave
- 19736 Times Ave
- 21806 Meekland Ave
- 188 Sunset Blvd
- 19837 Waverly Ave
- 492 Sunset Blvd
- 188 Laurel Ave
- 680 Sunset Blvd
- 17779 Rainier Ave
- 389 Saint George St
- 367 Saint George St
- 20831 Haviland Ave
- 361 Saint George St
- 20863 Haviland Ave
- 390 Saint George St
- 370 Saint George St
- 20627 Haviland Ave
- 364 Saint George St
- 355 Saint George St
- 20638 Blossom Common
- 20762 Haviland Ave
- 20730 Haviland Ave
- 20832 Haviland Ave
- 356 Saint George St
- 20660 Haviland Ave
- 479 Cherry Way
- 461 Cherry Way
- 20646 Blossom Common
- 20630 Blossom Common