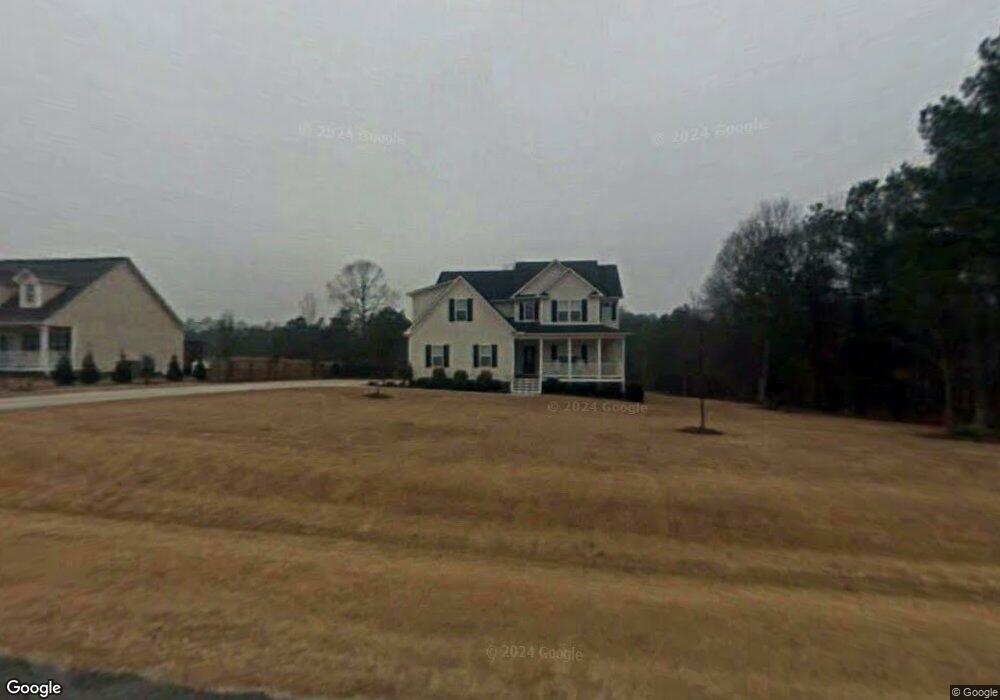
385 Steve Ridge Willow Spring, NC 27592
Pleasant Grove NeighborhoodEstimated Value: $470,920 - $524,000
4
Beds
3
Baths
2,553
Sq Ft
$190/Sq Ft
Est. Value
About This Home
This home is located at 385 Steve Ridge, Willow Spring, NC 27592 and is currently estimated at $485,230, approximately $190 per square foot. 385 Steve Ridge is a home located in Johnston County with nearby schools including Dixon Road Elementary School, McGee's Crossroads Middle School, and West Johnston High School.
Ownership History
Date
Name
Owned For
Owner Type
Purchase Details
Closed on
Sep 24, 2019
Sold by
Barnes Danny C and Barnes Mary Beth
Bought by
Leonesio Justin Michael and Leonesio Katelin Prouty
Current Estimated Value
Home Financials for this Owner
Home Financials are based on the most recent Mortgage that was taken out on this home.
Original Mortgage
$250,000
Outstanding Balance
$218,981
Interest Rate
3.6%
Estimated Equity
$266,249
Purchase Details
Closed on
Apr 22, 2008
Sold by
Rhodes Brian D and Rhodes Susan J
Bought by
Barnes Danny C and Barnes Mary Beth
Purchase Details
Closed on
May 6, 2005
Sold by
Carroll Construction Inc
Bought by
Rhodes Brian D and Rhodes Susan J
Home Financials for this Owner
Home Financials are based on the most recent Mortgage that was taken out on this home.
Original Mortgage
$194,178
Interest Rate
5.74%
Mortgage Type
New Conventional
Purchase Details
Closed on
Nov 24, 2004
Sold by
Carroll Construction Inc
Bought by
Son Lan Development Co Inc
Create a Home Valuation Report for This Property
The Home Valuation Report is an in-depth analysis detailing your home's value as well as a comparison with similar homes in the area
Home Values in the Area
Average Home Value in this Area
Purchase History
| Date | Buyer | Sale Price | Title Company |
|---|---|---|---|
| Leonesio Justin Michael | $312,000 | None Available | |
| Barnes Danny C | $250,000 | None Available | |
| Rhodes Brian D | $211,000 | None Available | |
| Son Lan Development Co Inc | -- | -- |
Source: Public Records
Mortgage History
| Date | Status | Borrower | Loan Amount |
|---|---|---|---|
| Open | Leonesio Justin Michael | $250,000 | |
| Previous Owner | Rhodes Brian D | $194,178 |
Source: Public Records
Tax History
| Year | Tax Paid | Tax Assessment Tax Assessment Total Assessment is a certain percentage of the fair market value that is determined by local assessors to be the total taxable value of land and additions on the property. | Land | Improvement |
|---|---|---|---|---|
| 2025 | $2,696 | $424,580 | $85,000 | $339,580 |
| 2024 | $2,270 | $280,230 | $46,000 | $234,230 |
| 2023 | $2,200 | $280,230 | $46,000 | $234,230 |
| 2022 | $2,270 | $280,230 | $46,000 | $234,230 |
| 2021 | $2,270 | $280,230 | $46,000 | $234,230 |
| 2020 | $2,354 | $280,230 | $46,000 | $234,230 |
| 2019 | $2,298 | $280,230 | $46,000 | $234,230 |
| 2018 | $2,051 | $244,160 | $35,000 | $209,160 |
| 2017 | $2,051 | $244,160 | $35,000 | $209,160 |
| 2016 | $2,051 | $244,160 | $35,000 | $209,160 |
| 2015 | $2,051 | $244,160 | $35,000 | $209,160 |
| 2014 | $2,051 | $244,160 | $35,000 | $209,160 |
Source: Public Records
Map
Nearby Homes
- 222 Susan Dr
- 102 Ina Joe Place
- 909 Mount Pleasant Rd
- 71 Rosa Cir
- 115 Edmondson Dr
- 200 Reese Dr
- 50 Linden Ct
- 167 Windy Dr
- 595 Durwood Dr
- 248 Old Hickory Dr
- 110 Freewill Place
- 221 Old Hickory Dr
- 108 Blueberry Ln
- 100 Blackberry Creek Dr
- 127 Wagon Trail
- 420 Beulah Milton Dr
- 1941 White Memorial Church Rd
- 232 Fawn Hill Ct
- 181 Fawn Hill Ct
- 304 Artic Cir
- 385 Steve Ridge
- 363 Steve Ridge
- 395 Steve Ridge
- 376 Steve Ridge
- 376 Steve Ridge
- 388 Steve Ridge
- 396 Steve Ridge
- 396 Steve Ridge
- 341 Steve Ridge
- 344 Steve Ridge
- 344 Steve Ridge
- 322 Steve Ridge
- 299 Steve Ridge
- 318 Steve Ridge
- 294 Steve Ridge
- 294 Steve Ridge
- 279 Steve Ridge
- 78 Veron Ct
- 256 Steve Ridge
- 235 Steve Ridge
Your Personal Tour Guide
Ask me questions while you tour the home.