Estimated Value: $378,578 - $442,000
5
Beds
3
Baths
3,160
Sq Ft
$127/Sq Ft
Est. Value
About This Home
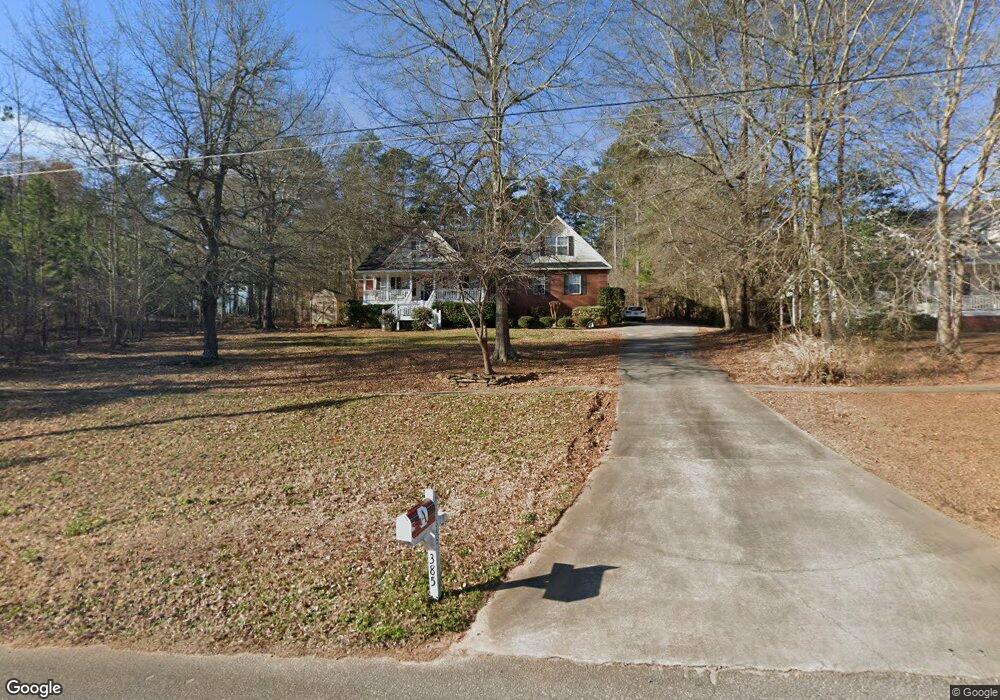
This home is located at 385 Twin Lakes Dr, Gray, GA 31032 and is currently estimated at $401,895, approximately $127 per square foot. 385 Twin Lakes Dr is a home located in Jones County with nearby schools including Turner Woods Elementary School, Gray Station Middle School, and Jones County High School.
Ownership History
Date
Name
Owned For
Owner Type
Purchase Details
Closed on
Feb 18, 2011
Sold by
Aspinwall Klay A
Bought by
Aspinwall Klay A
Current Estimated Value
Home Financials for this Owner
Home Financials are based on the most recent Mortgage that was taken out on this home.
Original Mortgage
$176,165
Outstanding Balance
$120,144
Interest Rate
4.71%
Mortgage Type
New Conventional
Estimated Equity
$281,751
Purchase Details
Closed on
Nov 25, 2003
Sold by
Sauls Clark and Sauls Marilyn
Bought by
Sanco Builders Inc
Purchase Details
Closed on
Mar 3, 2003
Sold by
Bank Of Eastman
Bought by
Sauls Clark and Sauls Marilyn
Purchase Details
Closed on
Jul 10, 2002
Sold by
Daniels James Keath
Bought by
Michael Willis Construction Inc
Purchase Details
Closed on
Sep 19, 2000
Bought by
Daniels James Keath
Create a Home Valuation Report for This Property
The Home Valuation Report is an in-depth analysis detailing your home's value as well as a comparison with similar homes in the area
Home Values in the Area
Average Home Value in this Area
Purchase History
| Date | Buyer | Sale Price | Title Company |
|---|---|---|---|
| Aspinwall Klay A | $170,000 | -- | |
| Aspinwall Klay A | $170,000 | -- | |
| Sanco Builders Inc | $27,300 | -- | |
| Sauls Clark | $26,700 | -- | |
| Michael Willis Construction Inc | $25,000 | -- | |
| Daniels James Keath | $22,000 | -- |
Source: Public Records
Mortgage History
| Date | Status | Borrower | Loan Amount |
|---|---|---|---|
| Open | Aspinwall Klay A | $176,165 |
Source: Public Records
Tax History Compared to Growth
Tax History
| Year | Tax Paid | Tax Assessment Tax Assessment Total Assessment is a certain percentage of the fair market value that is determined by local assessors to be the total taxable value of land and additions on the property. | Land | Improvement |
|---|---|---|---|---|
| 2023 | $3,750 | $104,374 | $10,810 | $93,564 |
| 2022 | $3,726 | $103,726 | $10,162 | $93,564 |
| 2021 | $3,730 | $103,726 | $10,162 | $93,564 |
| 2020 | $3,733 | $103,726 | $10,162 | $93,564 |
| 2019 | $3,536 | $98,252 | $10,162 | $88,090 |
| 2018 | $3,536 | $98,252 | $10,162 | $88,090 |
| 2017 | $3,525 | $97,944 | $10,162 | $87,782 |
| 2016 | $3,525 | $97,944 | $10,162 | $87,782 |
| 2015 | $3,334 | $97,944 | $10,162 | $87,782 |
| 2014 | $3,069 | $97,944 | $10,162 | $87,782 |
Source: Public Records
Map
Nearby Homes
- 229 Lite N Tie Rd
- 00 Hidden Hills Ct
- 140 Lite-N-tie Rd
- 0 Clinton Crossing Dr Unit M181966
- 250 Stone Brooke Dr Unit LOT 133
- 250 Stone Brooke Dr
- 146 Lite N Tie Rd
- 664 Aarons Cir
- 266 Clinton Crossing Dr
- 0 Clinton Crossing Unit 10637924
- 151 Stone Brooke Dr
- 151 Stone Brooke Dr Unit LOT 5
- Bedford Plan at Stone Brooke
- Auburn Plan at Stone Brooke
- Franklin Plan at Stone Brooke
- Peachwood Plan at Stone Brooke
- Woodbury Plan at Stone Brooke
- LOT 1 C Georgia 18
- 1023 Boulder Dr Unit LOT 65
- 1023 Boulder Dr
- 387 Twin Lakes Dr
- 0 Twin Lakes Dr Unit 7400769
- 0 Twin Lakes Dr Unit 3030442
- 377 Twin Lakes Dr
- 393 Twin Lakes Dr
- 386 Twin Lakes Dr
- 378 Twin Lakes Dr
- 390 Twin Lakes Dr
- 373 Twin Lakes Dr
- 251 Lite N Tie Rd
- 251 Lite N Tie Rd
- 395 Twin Lakes Dr
- 395 Twin Lakes Dr Unit 59
- 251 Lite-N-tie Rd
- 245 Lite N Tie Rd
- 374 Twin Lakes Dr
- 396 Twin Lakes Dr
- 259 Lite N Tie Rd
- 369 Twin Lakes Dr
- 239 Lite N Tie Rd