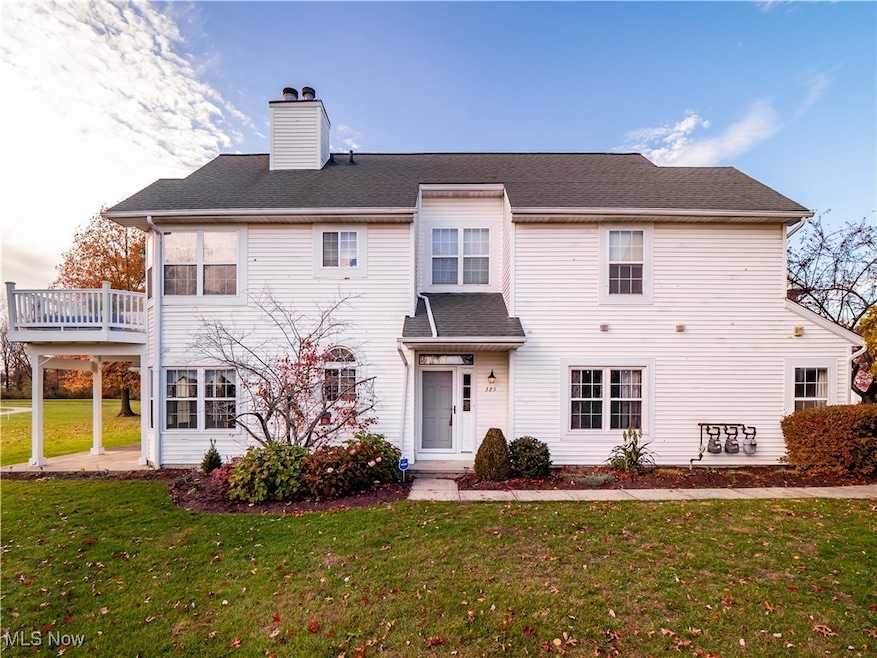
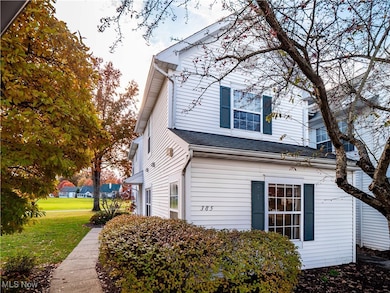
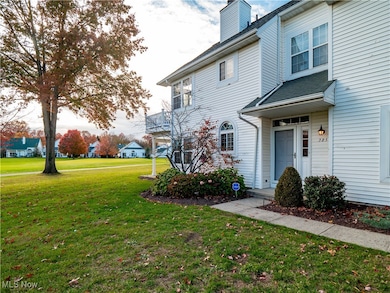
385 Vista Cir North Olmsted, OH 44070
Estimated payment $1,902/month
Highlights
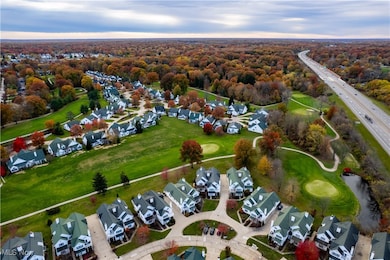
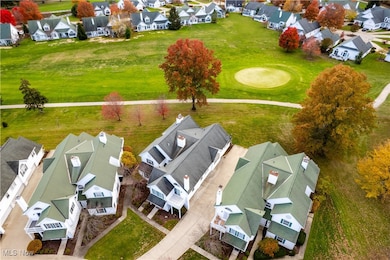
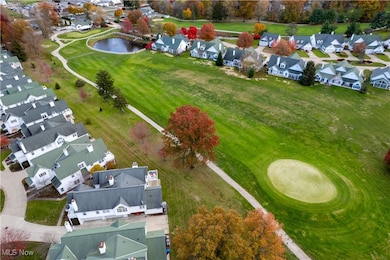
- On Golf Course
- Medical Services
- Cul-De-Sac
- North Olmsted Middle School Rated 9+
- Vaulted Ceiling
- 2 Car Attached Garage
About This Home
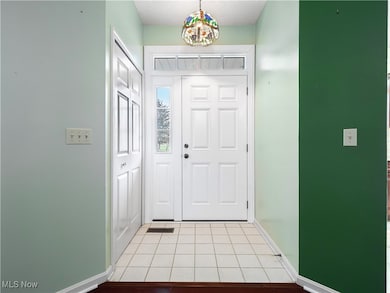
Experience the perfect blend of comfort and convenience at 385 Vista Circle, where everyday living feels effortless. One of the community’s larger floor plans at nearly 1480 square feet, this 2 bedroom, 2 bathroom home offers true one-floor living with no stairs to climb and a private main-level entrance. Step inside to an open and inviting layout featuring a spacious family room centered around a cozy three-way fireplace that is perfect for relaxing or entertaining. The refreshed kitchen offers abundant cabinet and counter space, complemented by a bright dinette area with a charming bay window that fills the space with natural light. The vaulted primary suite is complete with an en suite bath featuring double sinks, a large shower with glass door, and a walk-in closet. A generous second bedroom, remodeled full guest bath, and a versatile den with French doors provide plenty of space for guests or a home office. Enjoy the ease of in-suite laundry and the convenience of an attached two-car garage that leads directly into the unit. All appliances stay. The large patio is perfect for outdoor dining or simply soaking in the peaceful views of the North Olmsted Golf Club. Located in a well-maintained community offering a low-maintenance lifestyle, this home is just minutes from I-480, Great Northern Mall, restaurants, parks, and all the conveniences North Olmsted has to offer. Come see today!
Listing Agent
EXP Realty, LLC. Brokerage Email: brian@thesalemteam.com, 216-244-2549 License #2002000786 Listed on: 11/06/2025

Co-Listing Agent
EXP Realty, LLC. Brokerage Email: brian@thesalemteam.com, 216-244-2549 License #2023006796
Open House Schedule
-
Sunday, November 16, 202511:00 am to 1:00 pm11/16/2025 11:00:00 AM +00:0011/16/2025 1:00:00 PM +00:00Add to Calendar
Home Details
Home Type
- Single Family
Est. Annual Taxes
- $5,471
Year Built
- Built in 1994
Lot Details
- 2,627 Sq Ft Lot
- Lot Dimensions are 44x66
- On Golf Course
- Cul-De-Sac
HOA Fees
- $170 Monthly HOA Fees
Parking
- 2 Car Attached Garage
Home Design
- Cluster Home
- Entry on the 1st floor
- Slab Foundation
- Fiberglass Roof
- Asphalt Roof
- Vinyl Siding
Interior Spaces
- 1,480 Sq Ft Home
- 1-Story Property
- Vaulted Ceiling
- Double Sided Fireplace
- Gas Fireplace
- Family Room with Fireplace
- Golf Course Views
Kitchen
- Range
- Microwave
- Dishwasher
Bedrooms and Bathrooms
- 2 Main Level Bedrooms
- 2 Full Bathrooms
Laundry
- Laundry in unit
- Dryer
- Washer
Outdoor Features
- Patio
Utilities
- Forced Air Heating and Cooling System
- Heating System Uses Gas
Listing and Financial Details
- Assessor Parcel Number 235-24-084
Community Details
Overview
- Association fees include management, insurance, ground maintenance, reserve fund, snow removal, trash
- View Point HOA
- View Point Subdivision
Amenities
- Medical Services
- Common Area
- Shops
Recreation
- Golf Course Community
- Park
Map
Home Values in the Area
Average Home Value in this Area
Tax History
| Year | Tax Paid | Tax Assessment Tax Assessment Total Assessment is a certain percentage of the fair market value that is determined by local assessors to be the total taxable value of land and additions on the property. | Land | Improvement |
|---|---|---|---|---|
| 2024 | $5,471 | $79,835 | $13,440 | $66,395 |
| 2023 | $5,403 | $66,160 | $13,970 | $52,190 |
| 2022 | $5,375 | $66,150 | $13,970 | $52,190 |
| 2021 | $4,864 | $66,150 | $13,970 | $52,190 |
| 2020 | $4,463 | $53,760 | $11,340 | $42,420 |
| 2019 | $4,343 | $153,600 | $32,400 | $121,200 |
| 2018 | $4,393 | $53,760 | $11,340 | $42,420 |
| 2017 | $4,455 | $50,060 | $7,950 | $42,110 |
| 2016 | $4,416 | $50,060 | $7,950 | $42,110 |
| 2015 | $4,577 | $50,060 | $7,950 | $42,110 |
| 2014 | $4,577 | $51,590 | $8,190 | $43,400 |
Property History
| Date | Event | Price | List to Sale | Price per Sq Ft |
|---|---|---|---|---|
| 11/13/2025 11/13/25 | Price Changed | $242,000 | -3.2% | $164 / Sq Ft |
| 11/06/2025 11/06/25 | For Sale | $249,900 | -- | $169 / Sq Ft |
Purchase History
| Date | Type | Sale Price | Title Company |
|---|---|---|---|
| Warranty Deed | $162,000 | City Title Agency | |
| Interfamily Deed Transfer | -- | Attorney | |
| Deed | $144,900 | -- | |
| Deed | -- | -- |
Mortgage History
| Date | Status | Loan Amount | Loan Type |
|---|---|---|---|
| Closed | $100,000 | Fannie Mae Freddie Mac |
Source: MLS Now
MLS Number: 5170037
APN: 235-24-084
Disclaimer: Certain information contained herein is derived from information provided by parties other than Homes.com. All information provided is deemed reliable, but is not guaranteed to be accurate and should be independently verified.
![]() IDX information is provided exclusively for personal, non-commercial use, and may not be used for any purpose other than to identify prospective properties consumers may be interested in purchasing. Information is deemed reliable but not guaranteed.
IDX information is provided exclusively for personal, non-commercial use, and may not be used for any purpose other than to identify prospective properties consumers may be interested in purchasing. Information is deemed reliable but not guaranteed.
- 274 Vista Cir Unit B
- 8 Golf View Ln
- 25305 Country Club Blvd Unit 10
- 5101 Lucydale Ave
- 26847 John Rd
- 27693 Butternut Ridge
- 5668 Allendale Dr
- VANDERBURGH Plan at Olmsted - Sanctuary of
- LYNDHURST Plan at Olmsted - Sanctuary of
- BELLEVILLE Plan at Olmsted - Sanctuary of
- ALDEN Plan at Olmsted - Sanctuary of
- VALE Plan at Olmsted - Sanctuary of
- BUCHANAN Plan at Olmsted - Sanctuary of
- 26915 Eastwood Ln
- 25735 Lorain Rd Unit 218
- 26946 Westwood Ln
- 26726 Leenders Ln
- 5248 W Park Dr
- 6427 Mackenzie Rd
- 5308 Columbia Rd
- 5264 Victoria Ln
- 26101 Country Club Blvd
- 25801 Country Club Blvd
- 5800 Great Northern Blvd
- 25735 Lorain Rd Unit 219
- 24851 Country Club Blvd
- 25151 Brookpark Rd
- 5250 Columbia Rd
- 4351 Dover Center Rd Unit North
- 4877 Columbia Rd
- 25157 Carlton Park
- 4809 Columbia Rd
- 4922 Grace Rd
- 27080 Oakwood Dr
- 28374 Nandina Dr Unit 2
- 4122 Columbia Square
- 4849 Grace Rd Unit 232
- 27279 Dunford Rd
- 4171 Linden Cir
- 30871 Lorain Rd