Estimated Value: $880,074 - $1,471,000
3
Beds
1
Bath
2,856
Sq Ft
$426/Sq Ft
Est. Value
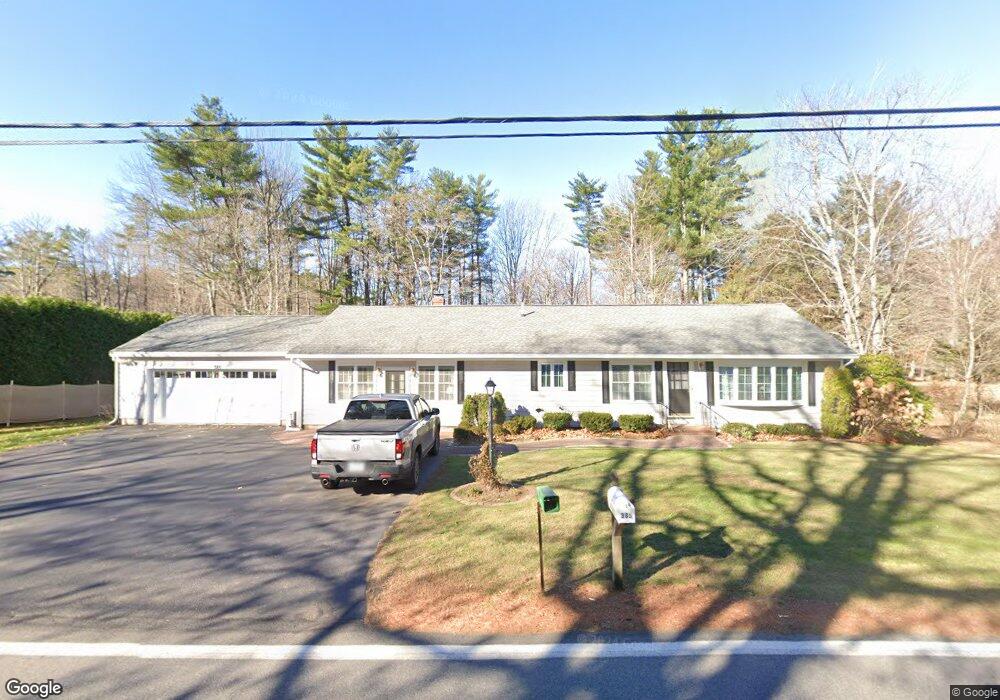
About This Home
This home is located at 385 West Rd, Rye, NH 03870 and is currently estimated at $1,216,019, approximately $425 per square foot. 385 West Rd is a home located in Rockingham County with nearby schools including Rye Elementary School, Rye Junior High School, and Rye Country Day School.
Ownership History
Date
Name
Owned For
Owner Type
Purchase Details
Closed on
Nov 12, 2025
Sold by
Dufresne David
Bought by
David A Dufresne Ret and Weber
Current Estimated Value
Purchase Details
Closed on
Jun 24, 2015
Sold by
David A Dufresne Ret and Dufresne
Bought by
David A Dufresne Ret and Dufresne
Home Financials for this Owner
Home Financials are based on the most recent Mortgage that was taken out on this home.
Original Mortgage
$637,500
Interest Rate
3.84%
Mortgage Type
Reverse Mortgage Home Equity Conversion Mortgage
Purchase Details
Closed on
Sep 26, 2014
Sold by
Dufresne David and Dufresne Mary E
Bought by
David A Rufresne Ret and Rufresne
Create a Home Valuation Report for This Property
The Home Valuation Report is an in-depth analysis detailing your home's value as well as a comparison with similar homes in the area
Home Values in the Area
Average Home Value in this Area
Purchase History
We collect this data history from publicly available records. To have your information removed, we recommend requesting removal directly through your county’s website.
| Date | Buyer | Sale Price | Title Company |
|---|---|---|---|
| David A Dufresne Ret | -- | -- | |
| David A Dufresne Ret | -- | -- | |
| David A Rufresne Ret | -- | -- | |
| David A Rufresne Ret | -- | -- |
Source: Public Records
Mortgage History
We collect this data history from publicly available records. To have your information removed, we recommend requesting removal directly through your county’s website.
| Date | Status | Borrower | Loan Amount |
|---|---|---|---|
| Previous Owner | David A Rufresne Ret | $637,500 |
Source: Public Records
Tax History
| Year | Tax Paid | Tax Assessment Tax Assessment Total Assessment is a certain percentage of the fair market value that is determined by local assessors to be the total taxable value of land and additions on the property. | Land | Improvement |
|---|---|---|---|---|
| 2025 | $5,506 | $657,800 | $384,300 | $273,500 |
| 2024 | $5,697 | $657,800 | $384,300 | $273,500 |
| 2023 | $5,282 | $657,800 | $384,300 | $273,500 |
| 2022 | $4,591 | $657,800 | $384,300 | $273,500 |
| 2021 | $4,510 | $441,300 | $283,500 | $157,800 |
| 2020 | $4,510 | $441,300 | $283,500 | $157,800 |
| 2019 | $4,510 | $441,300 | $283,500 | $157,800 |
| 2018 | $4,943 | $441,300 | $283,500 | $157,800 |
| 2017 | $4,462 | $441,300 | $283,500 | $157,800 |
| 2016 | $3,888 | $364,000 | $206,200 | $157,800 |
| 2013 | $3,993 | $364,000 | $206,200 | $157,800 |
Source: Public Records
Map
Nearby Homes
Your Personal Tour Guide
Ask me questions while you tour the home.