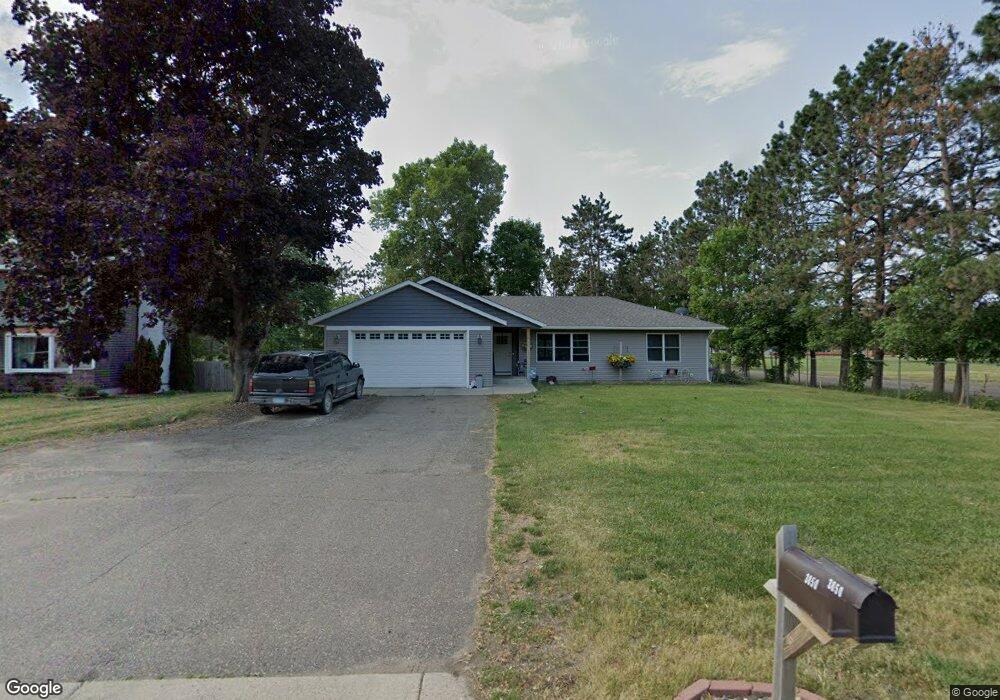
3850 220th St W Farmington, MN 55024
Estimated Value: $354,000 - $405,000
2
Beds
1
Bath
1,340
Sq Ft
$281/Sq Ft
Est. Value
About This Home
This home is located at 3850 220th St W, Farmington, MN 55024 and is currently estimated at $377,154, approximately $281 per square foot. 3850 220th St W is a home located in Dakota County with nearby schools including Farmington Elementary School, Robert Boeckman Middle School, and Farmington High School.
Ownership History
Date
Name
Owned For
Owner Type
Purchase Details
Closed on
Jul 29, 2011
Sold by
The First State Bank Of Rosemount
Bought by
Schultz James F and Schultz Martha D
Current Estimated Value
Home Financials for this Owner
Home Financials are based on the most recent Mortgage that was taken out on this home.
Original Mortgage
$65,000
Interest Rate
6.55%
Mortgage Type
Future Advance Clause Open End Mortgage
Purchase Details
Closed on
Jun 2, 2000
Sold by
Klaus Robert L and Klaus Geraldine H
Bought by
Klaus John R
Create a Home Valuation Report for This Property
The Home Valuation Report is an in-depth analysis detailing your home's value as well as a comparison with similar homes in the area
Home Values in the Area
Average Home Value in this Area
Purchase History
| Date | Buyer | Sale Price | Title Company |
|---|---|---|---|
| Schultz James F | $77,600 | Dca Title | |
| Klaus John R | $46,683 | -- |
Source: Public Records
Mortgage History
| Date | Status | Borrower | Loan Amount |
|---|---|---|---|
| Closed | Schultz James F | $65,000 |
Source: Public Records
Tax History Compared to Growth
Tax History
| Year | Tax Paid | Tax Assessment Tax Assessment Total Assessment is a certain percentage of the fair market value that is determined by local assessors to be the total taxable value of land and additions on the property. | Land | Improvement |
|---|---|---|---|---|
| 2024 | $4,482 | $368,100 | $78,300 | $289,800 |
| 2023 | $4,482 | $371,300 | $78,500 | $292,800 |
| 2022 | $4,492 | $363,400 | $78,300 | $285,100 |
| 2021 | $4,196 | $322,000 | $68,100 | $253,900 |
| 2020 | $4,008 | $300,500 | $50,000 | $250,500 |
| 2019 | $3,688 | $277,900 | $47,700 | $230,200 |
| 2018 | $1,765 | $253,500 | $45,400 | $208,100 |
| 2017 | $2,459 | $133,800 | $43,200 | $90,600 |
| 2016 | $2,233 | $170,100 | $41,100 | $129,000 |
| 2015 | $1,848 | $130,075 | $33,642 | $96,433 |
| 2014 | -- | $113,834 | $30,389 | $83,445 |
| 2013 | -- | $98,138 | $26,312 | $71,826 |
Source: Public Records
Map
Nearby Homes