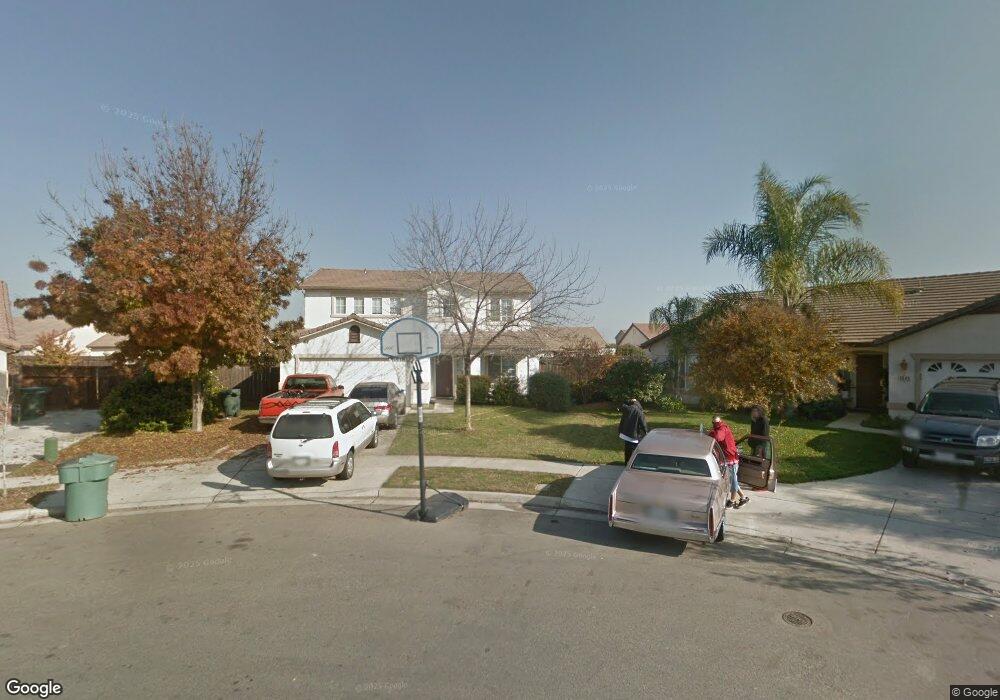
3850 E Villoy Ct Visalia, CA 93292
Northeast Visalia NeighborhoodEstimated Value: $416,000 - $498,000
4
Beds
3
Baths
1,933
Sq Ft
$227/Sq Ft
Est. Value
About This Home
This home is located at 3850 E Villoy Ct, Visalia, CA 93292 and is currently estimated at $438,950, approximately $227 per square foot. 3850 E Villoy Ct is a home located in Tulare County with nearby schools including Mineral King Elementary School, Valley Oak Middle School, and Golden West High School.
Ownership History
Date
Name
Owned For
Owner Type
Purchase Details
Closed on
Mar 23, 2012
Sold by
Bustamante Roberto S
Bought by
Bustamante Roberto S and Bustamante Olivia
Current Estimated Value
Purchase Details
Closed on
Aug 12, 2011
Sold by
Bustamante Roberto S
Bought by
Bustamante Roberto S and Bustamante Olivia
Home Financials for this Owner
Home Financials are based on the most recent Mortgage that was taken out on this home.
Original Mortgage
$116,000
Outstanding Balance
$79,979
Interest Rate
4.48%
Mortgage Type
New Conventional
Estimated Equity
$358,971
Purchase Details
Closed on
Jul 9, 2003
Sold by
Centex Homes
Bought by
Bustamante Roberto S and Sanchez Olivia
Home Financials for this Owner
Home Financials are based on the most recent Mortgage that was taken out on this home.
Original Mortgage
$148,564
Interest Rate
6.4%
Mortgage Type
Purchase Money Mortgage
Create a Home Valuation Report for This Property
The Home Valuation Report is an in-depth analysis detailing your home's value as well as a comparison with similar homes in the area
Home Values in the Area
Average Home Value in this Area
Purchase History
| Date | Buyer | Sale Price | Title Company |
|---|---|---|---|
| Bustamante Roberto S | -- | None Available | |
| Bustamante Roberto S | -- | Chicago Title Company | |
| Bustamante Roberto S | $171,000 | Commerce Title Insurance Co |
Source: Public Records
Mortgage History
| Date | Status | Borrower | Loan Amount |
|---|---|---|---|
| Open | Bustamante Roberto S | $116,000 | |
| Previous Owner | Bustamante Roberto S | $148,564 |
Source: Public Records
Tax History Compared to Growth
Tax History
| Year | Tax Paid | Tax Assessment Tax Assessment Total Assessment is a certain percentage of the fair market value that is determined by local assessors to be the total taxable value of land and additions on the property. | Land | Improvement |
|---|---|---|---|---|
| 2025 | $2,785 | $242,414 | $56,873 | $185,541 |
| 2024 | $2,785 | $237,661 | $55,758 | $181,903 |
| 2023 | $2,706 | $233,002 | $54,665 | $178,337 |
| 2022 | $2,621 | $228,435 | $53,594 | $174,841 |
| 2021 | $2,582 | $223,956 | $52,543 | $171,413 |
| 2020 | $2,556 | $221,659 | $52,004 | $169,655 |
| 2019 | $2,479 | $217,312 | $50,984 | $166,328 |
| 2018 | $2,414 | $213,051 | $49,984 | $163,067 |
| 2017 | $2,377 | $208,874 | $49,004 | $159,870 |
| 2016 | $2,327 | $204,778 | $48,043 | $156,735 |
| 2015 | $2,245 | $201,702 | $47,321 | $154,381 |
| 2014 | $2,245 | $197,751 | $46,394 | $151,357 |
Source: Public Records
Map
Nearby Homes
- 4237 E Murray Ave
- 4331 E Oak Ave
- 143 N Simon St
- 676 Sol Rd
- 825 N Manzanita St
- 3728 E Kaweah Ave
- 3621 E Douglas Ave
- 4122 E Kaweah Ave
- 4132 E Kaweah Ave
- 3926 E Myrtle Ave
- 1041 N Citrus Ct
- 1050 N Sumter Ct
- 3105 E Duran Ave
- 1139 N Citrus Ct
- 212 S Lovers Ln
- 804 S Simon St
- 1103 N Vista St
- 2721 E Goshen Ave
- 3203 E Houston Ave
- 2945 E College Ave
- 3846 E Villoy Ave
- 3846 E Villoy Ct
- 327 N Amador St
- 319 N Amador St
- 3849 E Villoy Ct
- 335 N Amador St
- 311 N Amador St
- 3838 E Villoy Ct
- 343 N Amador St
- 340 N Citrus St
- 247 N Amador St
- 3837 E Villoy Ct
- 403 N Amador St
- 3912 E Oak Ave
- 3920 E Oak Ave
- 3848 E Oak Ave
- 400 N Citrus St
- 326 N Amador St
- 310 N Citrus St
- 318 N Amador St