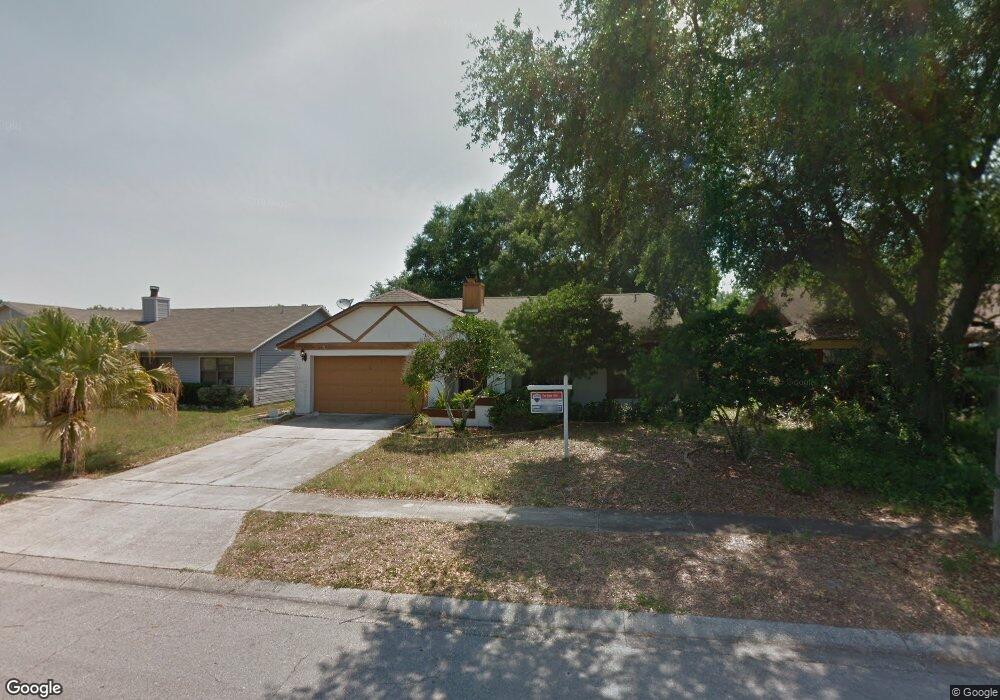
3850 Falling Leaf Ln Unit K-3850 Orlando, FL 32810
Lockhart NeighborhoodEstimated Value: $294,000 - $344,000
3
Beds
2
Baths
1,780
Sq Ft
$181/Sq Ft
Est. Value
About This Home
This home is located at 3850 Falling Leaf Ln Unit K-3850, Orlando, FL 32810 and is currently estimated at $322,513, approximately $181 per square foot. 3850 Falling Leaf Ln Unit K-3850 is a home located in Orange County with nearby schools including Riverside Elementary School, Lockhart Middle School, and Wekiva High School.
Ownership History
Date
Name
Owned For
Owner Type
Purchase Details
Closed on
Dec 18, 2017
Sold by
Khan Maryam
Bought by
Khan Saifuddin
Current Estimated Value
Purchase Details
Closed on
Aug 30, 2011
Sold by
Southeast Equity Holdings
Bought by
Khan Saifuddin and Khan Maryam
Purchase Details
Closed on
Aug 24, 2011
Sold by
Detcher Richard and Detcher Kimberly S
Bought by
South East Equity Holdings Llc
Purchase Details
Closed on
Apr 12, 2007
Sold by
Delbene Jo Ann and Dorris Craig
Bought by
Richards Kimberly S and Detcher Richard
Home Financials for this Owner
Home Financials are based on the most recent Mortgage that was taken out on this home.
Original Mortgage
$41,600
Interest Rate
6.1%
Mortgage Type
Stand Alone Second
Create a Home Valuation Report for This Property
The Home Valuation Report is an in-depth analysis detailing your home's value as well as a comparison with similar homes in the area
Home Values in the Area
Average Home Value in this Area
Purchase History
| Date | Buyer | Sale Price | Title Company |
|---|---|---|---|
| Khan Saifuddin | -- | None Available | |
| Khan Saifuddin | $73,500 | Southern Title & Abstra | |
| South East Equity Holdings Llc | $63,000 | Landing Title Agency Inc | |
| Richards Kimberly S | $208,000 | Watson Title Services Inc |
Source: Public Records
Mortgage History
| Date | Status | Borrower | Loan Amount |
|---|---|---|---|
| Previous Owner | Richards Kimberly S | $41,600 |
Source: Public Records
Tax History Compared to Growth
Tax History
| Year | Tax Paid | Tax Assessment Tax Assessment Total Assessment is a certain percentage of the fair market value that is determined by local assessors to be the total taxable value of land and additions on the property. | Land | Improvement |
|---|---|---|---|---|
| 2025 | $4,408 | $237,602 | -- | -- |
| 2024 | $3,958 | $237,602 | -- | -- |
| 2023 | $3,958 | $275,611 | $50,000 | $225,611 |
| 2022 | $3,546 | $240,353 | $50,000 | $190,353 |
| 2021 | $3,138 | $192,825 | $40,000 | $152,825 |
| 2020 | $2,818 | $179,847 | $40,000 | $139,847 |
| 2019 | $2,682 | $156,844 | $40,000 | $116,844 |
| 2018 | $2,430 | $134,148 | $29,500 | $104,648 |
| 2017 | $2,465 | $112,303 | $25,000 | $87,303 |
| 2016 | $2,039 | $104,148 | $22,000 | $82,148 |
| 2015 | $1,932 | $95,946 | $19,000 | $76,946 |
| 2014 | $1,804 | $83,277 | $19,000 | $64,277 |
Source: Public Records
Map
Nearby Homes
- 3711 Shady Grove Cir
- 3809 Needles Dr
- 8216 Hilton Way
- 3902 Castell Dr
- 3606 Needles Dr
- 2530 Domenico Paul Way
- 4221 Greenfern Dr
- 3423 Calumet Dr
- 4190 Rossmore Dr
- 2207 Calloway Dr
- 7736 Compass Dr
- 7918 Torro Ct
- 3201 Joyann St
- 3033 Sutton Dr
- 8542 Eden Park Rd
- 3024 Sutton Dr
- 8113 Eden Park Rd
- 4574 Sailbreeze Ct
- 7641 Compass Dr
- 938 Southridge Trail
- 3850 Falling Leaf Ln
- 3844 Falling Leaf Ln
- 3861 Shady Grove Cir
- 3762 Peaceful Place
- 3768 Peaceful Place
- 3855 Shady Grove Cir
- 3838 Falling Leaf Ln
- 3774 Peaceful Place
- 3807 Falling Leaf Ln
- 3843 Falling Leaf Ln
- 3750 Peaceful Place
- 3849 Shady Grove Cir
- 3837 Falling Leaf Ln
- 3856 Shady Grove Cir
- 3744 Peaceful Place
- 3850 Shady Grove Cir
- 3831 Falling Leaf Ln
- 3825 Shady Grove Cir
- 3813 Shady Grove Cir
- 3767 Peaceful Place