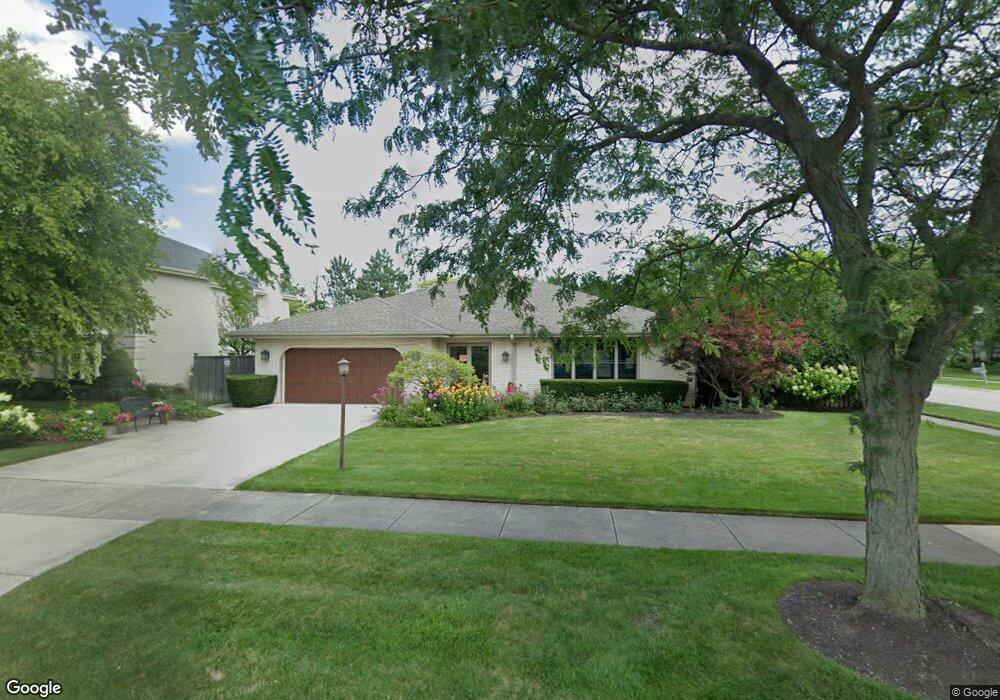
3850 Sally Ct Glenview, IL 60025
Estimated Value: $786,000 - $897,000
4
Beds
3
Baths
2,475
Sq Ft
$336/Sq Ft
Est. Value
About This Home
This home is located at 3850 Sally Ct, Glenview, IL 60025 and is currently estimated at $830,404, approximately $335 per square foot. 3850 Sally Ct is a home located in Cook County with nearby schools including Westbrook Elementary School, Glen Grove Elementary School, and Springman Middle School.
Ownership History
Date
Name
Owned For
Owner Type
Purchase Details
Closed on
Aug 18, 2015
Sold by
Eichler Thomas K and Eichler Helen L
Bought by
Eichler Thomas K and The Thomas K Eichler Revocable Living Tr
Current Estimated Value
Purchase Details
Closed on
Oct 30, 2006
Sold by
Heckmeck Saretta Lee
Bought by
Eichler Thomas K and Eichler Helen L
Home Financials for this Owner
Home Financials are based on the most recent Mortgage that was taken out on this home.
Original Mortgage
$350,000
Outstanding Balance
$195,740
Interest Rate
5.62%
Mortgage Type
Unknown
Estimated Equity
$634,664
Purchase Details
Closed on
May 19, 2000
Sold by
Heckmeck S Lee
Bought by
Heckmeck Saretta Lee and Saretta Lee Heckmeck Residence Trust
Home Financials for this Owner
Home Financials are based on the most recent Mortgage that was taken out on this home.
Original Mortgage
$360,000
Interest Rate
8.13%
Create a Home Valuation Report for This Property
The Home Valuation Report is an in-depth analysis detailing your home's value as well as a comparison with similar homes in the area
Home Values in the Area
Average Home Value in this Area
Purchase History
We collect this data history from publicly available records. To have your information removed, we recommend requesting removal directly through your county’s website.
| Date | Buyer | Sale Price | Title Company |
|---|---|---|---|
| Eichler Thomas K | -- | Attorney | |
| Eichler Thomas K | $555,000 | Cti | |
| Heckmeck Saretta Lee | -- | -- | |
| Heckmeck S Lee | $450,000 | -- |
Source: Public Records
Mortgage History
We collect this data history from publicly available records. To have your information removed, we recommend requesting removal directly through your county’s website.
| Date | Status | Borrower | Loan Amount |
|---|---|---|---|
| Open | Eichler Thomas K | $350,000 | |
| Previous Owner | Heckmeck Saretta Lee | $360,000 |
Source: Public Records
Tax History
| Year | Tax Paid | Tax Assessment Tax Assessment Total Assessment is a certain percentage of the fair market value that is determined by local assessors to be the total taxable value of land and additions on the property. | Land | Improvement |
|---|---|---|---|---|
| 2025 | -- | $68,000 | $16,480 | $51,520 |
| 2024 | -- | $56,000 | $13,983 | $42,017 |
| 2023 | -- | $56,000 | $13,983 | $42,017 |
| 2022 | $0 | $56,000 | $13,983 | $42,017 |
| 2021 | $10,699 | $50,050 | $11,735 | $38,315 |
| 2020 | $10,699 | $50,050 | $11,735 | $38,315 |
| 2019 | $0 | $55,000 | $11,735 | $43,265 |
| 2018 | $10,699 | $52,703 | $10,237 | $42,466 |
| 2017 | $10,438 | $52,703 | $10,237 | $42,466 |
| 2016 | $10,243 | $52,703 | $10,237 | $42,466 |
| 2015 | $10,355 | $48,040 | $8,240 | $39,800 |
| 2014 | $10,616 | $48,040 | $8,240 | $39,800 |
| 2013 | $10,284 | $48,040 | $8,240 | $39,800 |
Source: Public Records
Map
Nearby Homes
- 3720 Liberty Ln
- 3930 Gloria Ct
- 3843 Springdale Ave
- 3925 Triumvera Dr Unit 10B
- 1018 Castilian Ct Unit A209
- 1026 Castilian Ct Unit D162
- 10373 Dearlove Rd Unit 304
- 10385 Dearlove Rd Unit 1K
- 3700 Capri Ct Unit 206
- 1002 Castilian Ct Unit B302
- 10353 Dearlove Rd Unit 3A
- 10369 Dearlove Rd Unit 2A
- 1016 Longmeadow Dr
- 701 Forum Square Unit 607
- 638 Naples Ct Unit T23C
- 702 Cobblestone Cir Unit D
- 10357 Dearlove Rd Unit 1J
- 718 Cobblestone Cir Unit C
- 610 Revere Rd
- 684 Quincy Bridge Ln Unit 202
- 3854 Sally Ct
- 3858 Sally Ct
- 913 Neil Ln Unit 5
- 909 Neil Ln
- 902 Neil Ln Unit 5
- 3857 Sally Ct
- 917 Neil Ln
- 905 Neil Ln Unit 5
- 3861 Sally Ct Unit 6
- 3862 Sally Ct
- 901 Neil Ln
- 3841 Cindy Ln Unit 5
- 912 Tamer Ln
- 908 Tamer Ln
- 3866 Sally Ct Unit 6
- 3865 Sally Ct
- 3850 Glenview Rd
- 916 Tamer Ln
- 904 Tamer Ln
- 3869 Sally Ct
Your Personal Tour Guide
Ask me questions while you tour the home.