Estimated Value: $226,628 - $739,000
2
Beds
1
Bath
974
Sq Ft
$379/Sq Ft
Est. Value
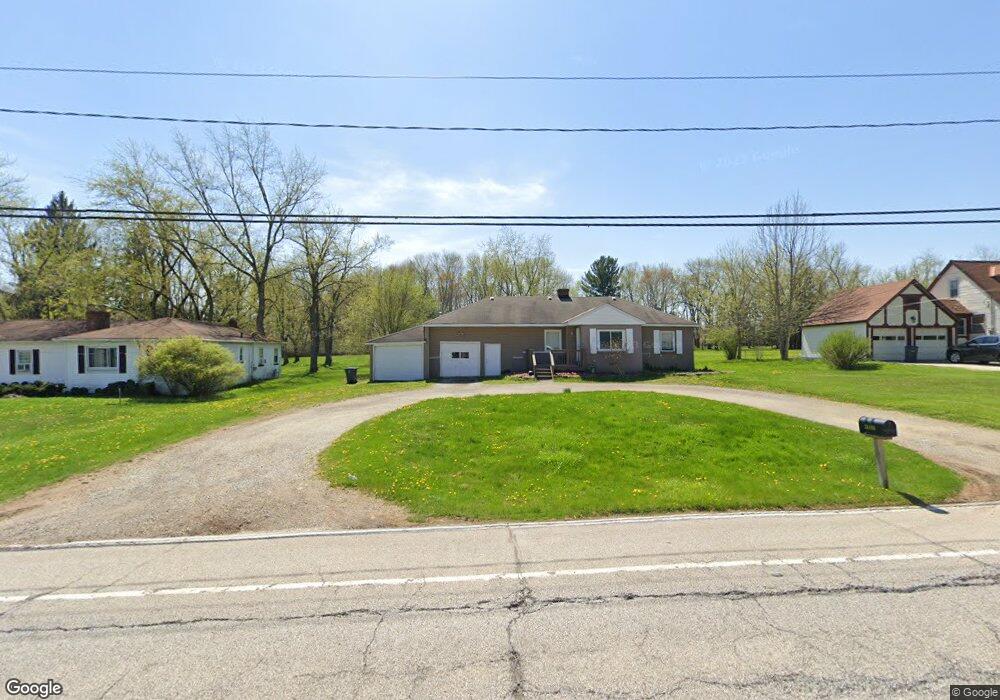
About This Home
This home is located at 38508 Aurora Rd, Solon, OH 44139 and is currently estimated at $369,157, approximately $379 per square foot. 38508 Aurora Rd is a home located in Cuyahoga County with nearby schools including Orchard Middle School, Solon Middle School, and Solon High School.
Ownership History
Date
Name
Owned For
Owner Type
Purchase Details
Closed on
Feb 4, 2026
Sold by
Adams James T
Bought by
Afe3 Llc
Current Estimated Value
Purchase Details
Closed on
Dec 28, 2010
Sold by
Crock Real Estate Investments Ii Llc
Bought by
Adams James T
Home Financials for this Owner
Home Financials are based on the most recent Mortgage that was taken out on this home.
Original Mortgage
$52,000
Interest Rate
4.5%
Mortgage Type
Purchase Money Mortgage
Purchase Details
Closed on
Jul 23, 2010
Sold by
Williams Brian E
Bought by
Crock Real Estate Investments Ii Llc
Purchase Details
Closed on
Aug 19, 1999
Sold by
Gray Gennilee R
Bought by
Williams Brian E
Purchase Details
Closed on
Feb 7, 1990
Sold by
Gray Steven H
Bought by
Gray Jennilee R
Purchase Details
Closed on
Dec 19, 1984
Sold by
Gray Steven H
Bought by
Gray Steven H
Purchase Details
Closed on
Jul 22, 1980
Sold by
Cinadr Matthew F and Cinadr Maureen A
Bought by
Gray Steven H
Purchase Details
Closed on
Sep 3, 1975
Sold by
Hradek Joseph A and Hradek Mary
Bought by
Cinadr Matthew F and Cinadr Maureen A
Purchase Details
Closed on
Jan 1, 1975
Bought by
Hradek Joseph A and Hradek Mary
Create a Home Valuation Report for This Property
The Home Valuation Report is an in-depth analysis detailing your home's value as well as a comparison with similar homes in the area
Home Values in the Area
Average Home Value in this Area
Purchase History
| Date | Buyer | Sale Price | Title Company |
|---|---|---|---|
| Afe3 Llc | -- | None Listed On Document | |
| Adams James T | $52,000 | Pvf Title | |
| Crock Real Estate Investments Ii Llc | $66,667 | None Available | |
| Williams Brian E | $32,000 | State Title Company | |
| Gray Jennilee R | -- | -- | |
| Gray Steven H | -- | -- | |
| Gray Steven H | $60,000 | -- | |
| Cinadr Matthew F | $38,500 | -- | |
| Hradek Joseph A | -- | -- |
Source: Public Records
Mortgage History
| Date | Status | Borrower | Loan Amount |
|---|---|---|---|
| Previous Owner | Adams James T | $52,000 |
Source: Public Records
Tax History
| Year | Tax Paid | Tax Assessment Tax Assessment Total Assessment is a certain percentage of the fair market value that is determined by local assessors to be the total taxable value of land and additions on the property. | Land | Improvement |
|---|---|---|---|---|
| 2025 | $4,179 | $66,185 | $17,955 | $48,230 |
| 2024 | $4,179 | $66,185 | $17,955 | $48,230 |
| 2023 | $4,102 | $53,030 | $13,020 | $40,010 |
| 2022 | $4,095 | $53,030 | $13,020 | $40,010 |
| 2021 | $4,057 | $53,030 | $13,020 | $40,010 |
| 2020 | $3,795 | $44,940 | $11,030 | $33,920 |
| 2019 | $3,692 | $128,400 | $31,500 | $96,900 |
| 2018 | $3,363 | $44,940 | $11,030 | $33,920 |
| 2017 | $3,584 | $45,720 | $10,120 | $35,600 |
| 2016 | $3,555 | $45,720 | $10,120 | $35,600 |
| 2015 | $3,432 | $45,720 | $10,120 | $35,600 |
| 2014 | $3,432 | $42,320 | $9,380 | $32,940 |
Source: Public Records
Map
Nearby Homes
- 38325 Pettibone Rd
- 38655 Pettibone Rd
- V/L Arlington Blvd
- 7368 Royal Portrush Dr
- 39600 Aurora Rd
- 38230 Flanders Dr
- 36965 Wexford Dr
- 36725 Pettibone Rd
- 7381 Portage St
- 7370 Stockwood Dr
- V/L 3-31 Willow St
- 7442 Worlington Dr
- 35160 Spatterdock Ln
- 6442 Dorset Ln
- 10564 Herrington Dr
- 39700 Alsace Ct
- 34603 Bramble Ln
- 39800 Alsace Ct
- 1177 Moneta Ave
- 1101 Lake Ave
- 38480 Aurora Rd
- 38510 Aurora Rd
- 38420 Aurora Rd
- 38550 Aurora Rd
- 38390 Aurora Rd
- 38600 Aurora Rd
- 38360 Aurora Rd
- 38475 Aurora Rd
- 38495 Aurora Rd
- 38515 Aurora Rd
- 38417 Aurora Rd
- 38535 Aurora Rd
- 38415 Pettibone Rd
- 38385 Aurora Rd
- 38630 Aurora Rd
- 38300 Aurora Rd
- 38475 Pettibone Rd
- 0 East Dr Unit 3465975
- 0 East Dr Unit 3673611
- 0 East Dr Unit 4066499
Your Personal Tour Guide
Ask me questions while you tour the home.