3851 Beach Rd South Lake Tahoe, CA 96150
Estimated Value: $621,000 - $1,028,000
3
Beds
1
Bath
1,900
Sq Ft
$440/Sq Ft
Est. Value
About This Home
This home is located at 3851 Beach Rd, South Lake Tahoe, CA 96150 and is currently estimated at $836,545, approximately $440 per square foot. 3851 Beach Rd is a home located in El Dorado County with nearby schools including Sierra House Elementary School, South Tahoe Middle School, and South Tahoe High School.
Ownership History
Date
Name
Owned For
Owner Type
Purchase Details
Closed on
Jan 26, 2021
Sold by
Mel Bartlett W and Carreira Maria M
Bought by
Mel Bartlett W and Carreira Maria M
Current Estimated Value
Purchase Details
Closed on
May 14, 2019
Sold by
Mel Bartlett W
Bought by
Mel Bartlett W and Mel Maria M
Purchase Details
Closed on
Sep 14, 2018
Sold by
Mel Bartlett W
Bought by
Mel Bartlett W and Carreira Maria M
Purchase Details
Closed on
Jul 5, 2005
Sold by
Mel Howard C and Howard C Mel Qualified Persona
Bought by
Defontenay Amelie C Mel and Defontenay Mel Stephanie
Purchase Details
Closed on
Jun 25, 1998
Sold by
Mel Nancy S
Bought by
Mel Nancy S and Nancy S Mel Qualified Personal
Purchase Details
Closed on
Nov 30, 1993
Sold by
Mel Howard C and Mel Nancy S
Bought by
Mel Howard C and Mel Nancy S
Create a Home Valuation Report for This Property
The Home Valuation Report is an in-depth analysis detailing your home's value as well as a comparison with similar homes in the area
Home Values in the Area
Average Home Value in this Area
Purchase History
| Date | Buyer | Sale Price | Title Company |
|---|---|---|---|
| Mel Bartlett W | -- | None Available | |
| Mel Stephanie F | -- | None Available | |
| Mel Bartlett W | -- | None Available | |
| Mel Bartlett W | -- | None Available | |
| Defontenay Amelie C Mel | -- | -- | |
| Defontenay Amelie C Mel | -- | -- | |
| Mel Nancy S | -- | -- | |
| Mel Howard C | -- | -- | |
| Mel Howard C | -- | -- | |
| Mel Howard C | -- | -- | |
| Mel Howard C | -- | -- |
Source: Public Records
Tax History Compared to Growth
Tax History
| Year | Tax Paid | Tax Assessment Tax Assessment Total Assessment is a certain percentage of the fair market value that is determined by local assessors to be the total taxable value of land and additions on the property. | Land | Improvement |
|---|---|---|---|---|
| 2025 | $1,931 | $176,559 | $144,157 | $32,402 |
| 2024 | $1,931 | $173,098 | $141,331 | $31,767 |
| 2023 | $1,898 | $169,705 | $138,560 | $31,145 |
| 2022 | $1,880 | $166,379 | $135,844 | $30,535 |
| 2021 | $1,851 | $163,118 | $133,181 | $29,937 |
| 2020 | $1,825 | $161,447 | $131,816 | $29,631 |
| 2019 | $1,816 | $158,282 | $129,232 | $29,050 |
| 2018 | $1,777 | $155,180 | $126,699 | $28,481 |
| 2017 | $1,750 | $152,138 | $124,215 | $27,923 |
| 2016 | $1,715 | $149,156 | $121,780 | $27,376 |
| 2015 | $1,697 | $146,917 | $119,951 | $26,966 |
| 2014 | $1,630 | $144,041 | $117,602 | $26,439 |
Source: Public Records
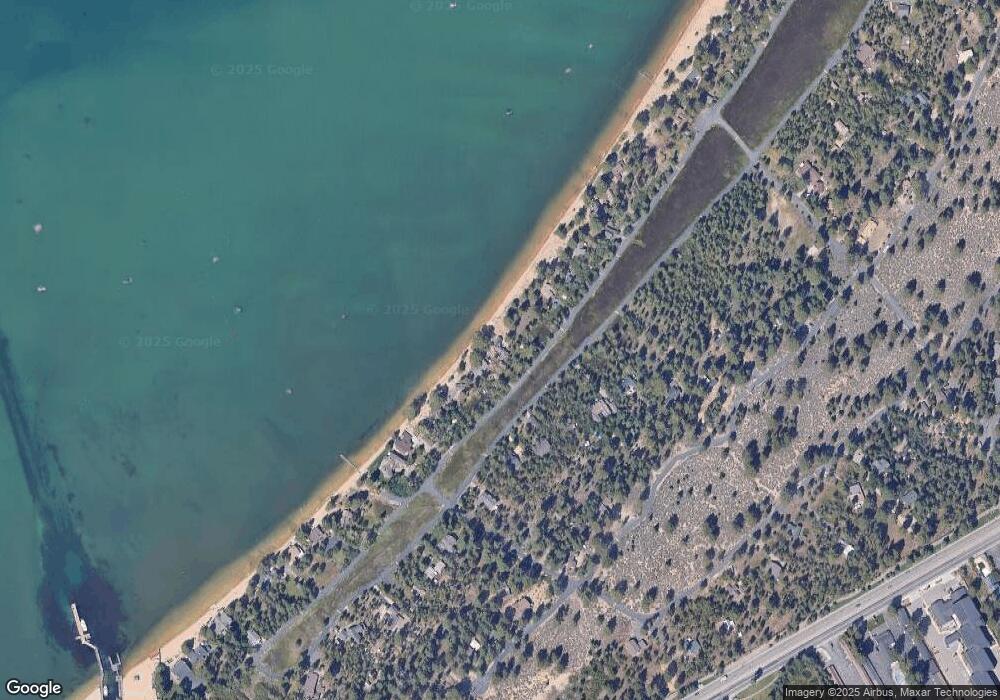
Map
Nearby Homes
- 3801 Paradise Ave
- 1037 Pine Grove Ave
- 3801 Forest Ave
- 3820 Pentagon Rd
- 3754 Forest Ave
- 3535 Lake Tahoe Blvd Unit 130
- 3535 Lake Tahoe Blvd Unit 231
- 3535 Lake Tahoe Blvd Unit 623
- 3535 Lake Tahoe Blvd Unit 520
- 3535 Lake Tahoe Blvd Unit 506
- 3535 Lake Tahoe Blvd Unit 499
- 3535 Lake Tahoe Blvd Unit 329
- 3535 Lake Tahoe Blvd Unit 313
- 3535 Lake Tahoe Blvd Unit 131
- 1014 Shepherds Dr
- 3695 Primrose Rd
- 3808 Larch Ave
- 3828 Steven Ln
- 1047 Cellador Rd
- 1152 Sonora Ave